Saturday, December 22, 2018

Applied evolutionary thinking: Darwin meets Washington

Charles Darwin, perhaps one of the greatest scholars of all time, thought about his theory of mutation, inheritance, and selection of biological traits for more than 20 years, and finally published it as a book in 1859.  At that time, many animal breeders must have said something like this: “So what? We knew this already.”

In fact George Washington, who died in 1799 (many years before Darwin’s famous book came out), had tried his hand at what today would be called “genetic engineering.” He produced at least a few notable breeds of domestic animals through selective breeding. Those include a breed of giant mules – the “Mammoth Jackstock” breed. Those mules are so big and strong that they were used to pull large boats filled with coal along artificial canals in Pennsylvania.

Washington learned the basic principles of animal breeding from others, who learned it from others, and so on. Animal breeding has a long tradition.

So, not only did animal breeders, like George Washington, had known about the principles of mutation, inheritance, and selection of biological traits; but they also had been putting that knowledge into practice for quite some time before Darwin’s famous book “The Origin of Species” was published.

Yet, Darwin’s theory has applications that extend well beyond animal breeding. There are thousands of phenomena that would look very “mysterious” today without Darwin’s theory. Many of those phenomena apply to nutrition and lifestyle, as we have been seeing lately with the paleo diet movement. Among the most amazing and counterintuitive are those in connection with the design of our brain.

Recent research, for instance, suggests that “surprise” improves cognition. Let me illustrate this with a simple example. If you were studying a subject online that required memorization of key pieces of information (say, historical facts) and a surprise stimulus was “thrown” at you (say, a video clip of an attacking rattlesnake was shown on the screen), you would remember the key pieces of information (about historical facts) much better than if the surprise stimulus was not present!

The underlying Darwinian reason for this phenomenon is that it is adaptively advantageous for our brain to enhance our memory in dangerous situations (e.g., an attack by a poisonous snake), because that would help us avoid those situations in the future (Kock et al., 2008; references listed at the end of this post). Related mental mechanisms increased our ancestors’ chances of survival over many generations, and became embedded in our brain’s design.

Animal breeders knew that they could apply selection, via selective breeding, to any population of animals, and thus make certain traits evolve in a matter of a few dozen generations or less. This is known as artificial selection. Among those traits were metabolic traits. For example, a population of lambs may be bred to grow fatter on the same amount of food as leaner breeds.

Forced natural selection may have been imposed on some of our ancestors, as I argue in this post, leading metabolic traits to evolve in as little as 396 years, or even less, depending on the circumstances.

In a sense, forced selection would be a bit like artificial selection. If a group of our ancestors became geographically isolated from others, in an environment where only certain types of food were available, physiological and metabolic adaptations to those types of food might evolve. This is also true for the adoption of cultural practices; culture can also strongly influence evolution (see, e.g., McElreath & Boyd, 2007).

This is why it is arguably a good idea for people to look at their background (i.e., learn about their ancestors), because they may have inherited genes that predispose them to function better with certain types of diets and lifestyles. That can help them better tailor their diets to their genetic makeup, and also understand why certain diets work for some people but not for others. (This is essentially what medical doctors do, on a smaller time scale, when they take a patients' parents health history into consideration when dispensing medical advice.)

By ancestors I am not talking about Homo erectus here, but ancestors that lived 3,000; 1,000; or even 500 years ago. At times when medical care and other modern amenities were not available, and thus selection pressures were stronger. For example, if your no-so-distant ancestors have consumed plenty of dairy, chances are you are better adapted to consume dairy than people whose ancestors have not.

Very recent food inventions, like refined carbohydrates, refined sugars, and hydrogenated fats are too new to have influenced the genetic makeup of anybody living today. So, chances are, they are bad for the vast majority of us. (A small percentage of the population may not develop any hint of diseases of civilization after consuming them for years, but they are not going to be as healthy as they could be.) Other, not so recent, food inventions, such as olive oil, certain types of bread, certain types of dairy, may be better for some people than for others.

References:

Kock, N., Chatelain-Jardón, R., & Carmona, J. (2008). An experimental study of simulated web-based threats and their impact on knowledge communication effectiveness. IEEE Transactions on Professional Communication, 51(2), 183-197.

McElreath, R., & Boyd, R. (2007). Mathematical models of social evolution: A guide for the perplexed. Chicago, IL: The University of Chicago Press.

Sunday, September 23, 2018

Vitamin D levels: Sunlight, age, and toxicity

Calcidiol is a pre-hormone that is produced based on vitamin D3 in the liver. Blood concentration of calcidiol is considered to be a reliable indicator of vitamin D status. In the research literature, calcidiol is usually referred to as 25-Hydroxyvitamin or 25(OH)D. Calcidiol is converted in the kidneys into calcitriol, which is the active form of vitamin D.

The table below (from: Vieth, 1999; full reference at the end of this post; click on it to enlarge), shows the average blood vitamin D levels of people living or working in sun-rich environments. To convert from nmol/L to ng/mL, divide by 2.496. For example, 100 nmol/L = 100 / 2.496 ng/mL = 40.1 ng/mL. At the time of this writing, Vieth (1999) had over 1500 citations on Google Scholar, and probably a large number as well on Web of Science. This article has had, and continues having, a high impact among researchers.


The maximum average level of blood (or serum) vitamin D shown in the table is 163 nmol/L (65 ng/mL). Given that the human body produces vitamin D naturally from sunlight, it is reasonable to assume that those blood vitamin D levels are not yet at the toxic range. In fact, one of the individuals, a farmer in Puerto Rico, had a level of 225 nmol/L (90 ng/mL). That individual had no signs of toxicity.

Several studies show that pre-sunburn full-body exposure to sunlight is equivalent to an oral vitamin D intake of approximately 250 µg (10,000 IU).

In spite of claims to the contrary, vitamin D production based on sunlight does not cease after 40 years of age or so. Studies reviewed by Vieth suggest that among the elderly (i.e., those aged 65 or above) pre-sunburn full-body exposure to sunlight is equivalent to an oral vitamin D intake of 218 µg (8,700 IU).

Sunlight-induced vitamin D production does seem to decrease with age, but not dramatically.

Post-sunburn sunlight exposure does not increase vitamin D production. Since each person is different, a good rule of thumb to estimate the number of minutes of sunlight exposure needed to maximize vitamin D production is the number of minutes preceding sunburn. For a light-skinned person, this can be as little as 7 minutes.

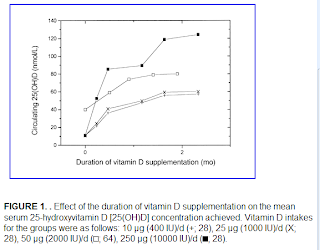
Vitamin D accumulation in the body follows a battery-like pattern, increasing and decreasing gradually. The figure below, from Vieth’s article, shows the gradual increase in blood vitamin D concentrations following the start of daily supplementation. This suggests that levels start to plateau at around 1 month, with higher levels reaching a plateau after 2 months.


While sunlight exposure does not lead to toxic levels of vitamin D, oral intake may. Below is a figure, also from Vieth’s article, that plots blood levels of vitamin D against oral intake amounts. The X’s indicate points at which intoxication symptoms were observed. While typically intoxication starts at the 50,000 IU intake level, one individual displayed signs of intoxication at 10,000 IU. That individual received a megadose that was supposed to provide vitamin D for an extended period of time.


Non-toxic levels of 10,000 IU are achieved naturally through sunlight exposure. This applies to modern humans and probably our Paleolithic ancestors. Yet, modern humans normally limit their sun exposure and intake of vitamin D to levels (400 IU) that are only effective to avoid osteomalacia, the softening of the bones due to poor mineralization.

Very likely the natural production of 10,000 IU based on sunlight was adaptive in our evolutionary past, and also necessary for good health today. This is consistent with the many reports of diseases associated with chronic vitamin D deficiency, even at levels that avoid osteomalacia. Among those diseases are: hypertension, tuberculosis, various types of cancer, gingivitis, multiple sclerosis, chronic inflammation, seasonal affective disorder, and premature senescence.

Reference:

Reinhold Vieth (May 1999). Vitamin D supplementation, 25-hydroxyvitamin D concentrations, and safety. American Journal of Clinical Nutrition, Vol. 69, No. 5, 842-856.

Saturday, August 25, 2018

Niacin and its effects on growth hormone, glucagon, cortisol, blood lipids, mental disorders, and fasting glucose levels

Niacin is a very interesting vitamin. It is also known as vitamin B3, or nicotinic acid. It is an essential vitamin whose deficiency leads to a dreadful disease known as pellagra. In large doses of 1 to 3 g per day it has several effects on blood lipids, including these: it increases HDL cholesterol, decreases triglycerides, and decreases Lp(a). Given that this is essentially a reversal of the metabolic syndrome, for those who are on their way to developing it, niacin must really do something good for our body. Niacin is also a powerful antioxidant.

The lipid modification effects of niacin are so consistent across a broad spectrum of the population that some companies that commercialize niacin-based products guarantee some measure of those effects. The graphs below (click to enlarge) are from Arizona Pharmaceuticals, a company that commercializes an instant-release niacin formulation called Nialor (see: arizonapharmaceuticals.com). The graphs show the peak effects on HDL cholesterol and triglycerides at the recommended dose, which is 1.5 g per day. The company guarantees effects; not the peak effects shown, but effects that are large enough to have clinical significance.


Niacin also has been used in the treatment of various mental disorders, including schizophrenia. Its effectiveness in this domain (mental disease) is still under debate. Yet many people, including reputable mental health researchers, swear by it. Empirical research suggests beyond much doubt that niacin helps in the treatment of depression and bipolar disorder.

Abram Hoffer, a Canadian psychiatrist who died in 2009, at the age of 91, has discussed at length the many beneficial health effects of niacin. He was also a niacin user. He argued that it can even make people live longer, and be generally healthier and more active. The effect on longevity may sound far-fetched, but there is empirical data supporting this hypothesis as well. (For more, see this book.)

By the way, moderate niacin supplementation seems to increase the milk output of cows, without any effect on milk composition.

Most people dislike the sensation that is caused by niacin, the “niacin flush”. This is a temporary sensation similar to that of sunburn covering one’s full torso and face. It goes away after a few minutes. This is niacin’s main undesirable side effect at doses up to 3 g per day. Higher doses are not recommended, and can be toxic to the liver.

Nobody seems to understand very well how niacin works. This leads to some confusion. Many people think that niacin inhibits the production of VLDL, free fatty acids, and ketones; preventing the use of fat as an energy source. And it does!

So it makes you fat, right?

No, because these effects are temporary, and are followed, often after 3 to 5 hours, by a large increase in circulating growth hormone, cortisol and glucagon. These hormones are associated with (maybe they cause, maybe are caused by) a large increase in free fatty acids and ketones in circulation, but not with an increase in VLDL secretion by the liver. So ketosis is at first inhibited by niacin, and then comes in full force after a few hours.

The decreased VLDL secretion is no surprise, because VLDL is not really needed in large quantities if muscle tissues (including the heart) are being fed what they really like: free fatty acids and ketones. When VLDL particles are secreted by the liver in small numbers, they tend to be large. As they shrink in size after delivering their lipid content to muscle tissues, they become large LDL particles; too large to cross the endothelial gaps and cause plaque formation.

It is as if niacin held you back for a few hours, in terms of fat burning, and then released you with a strong push.

Since niacin does not seem to suppress the secretion of chylomicrons by the intestines, it should be taken with meals. The meals do not necessarily have to have any carbohydrates in them. If you take niacin while fasting, you may feel “funny” and somewhat weak, because of the decrease in VLDL, free fatty acids, and ketones in circulation. These, particularly the free fatty acids and ketones, are important sources of energy in the fasted state.

Given niacin’s delayed effects, it does not seem to make much sense to take slow release niacin of any kind. In fact, the form of niacin that seems to work best is the instant-release one, the one that gives you the flush. It may be a good idea to wait until 3 to 5 hours after you take it to do heavy exercise. You may feel a surge of energy 3 to 5 hours after taking it, when the delayed effects kick in.

The delayed effects of niacin on growth hormone, cortisol and glucagon are probably the reasons why people taking niacin frequently see a small increase in fasting glucose levels. This increase is usually of a few percentage points, but can be a bit higher in some people. Growth hormone, cortisol and particularly glucagon increase blood glucose levels; and the blood levels of these hormones naturally rise in the morning to get you ready for the day ahead. Niacin seems to boost that. Hence the increase in fasting blood glucose levels. This appears to be a benign effect, easily counterbalanced by niacin’s many benefits.

In spite of a possible increase in fasting glucose levels, there is no evidence that niacin increases average blood glucose levels. If it did, that would not be a good thing. In fact, it has been argued that niacin intake can be part of an effective approach to treating diabetes; Robert C. Atkins discussed this in his Vita-Nutrient Solution book.

Niacin’s effects on lipids are somewhat similar to those of low carbohydrate dieting. For example, both lead to a decrease in fasting triglycerides and an increase in HDL cholesterol. But the mechanisms by which those effects are achieved appear to be rather different.

References:

Quabbe, H.J., Trompke, M., & Luyckx, A.S. (1983). Influence of ketone body infusion on plasma growth hormone and glucagon in man. J. Clin Endocrinol Metab., 57(3):613-8.

Quabbe, H.J., Luyckx, A.S., L'age M., & Schwarz, C. (1983). Growth hormone, cortisol, and glucagon concentrations during plasma free fatty acid depression: different effects of nicotinic acid and an adenosine derivative (BM 11.189). J. Clin Endocrinol Metab., 57(2):410-4.

Schade, D.S., Woodside, W., & Eaton, R.P. (1979). The role of glucagon in the regulation of plasma lipids. Metabolism, 28(8):874-86.

Saturday, July 28, 2018

Low omega-6 to omega-3 ratio: Grain-fed meats or industrial vegetable oils?

Just a little note on the use of language. Clearly there is no such a thing as grain-fed or grass-fed beef, because one does not feed beef anything. One feeds cattle grain or grass, and then the resulting beef is said to be “grain-fed” or “grass-fed”. It is a manner of speaking that facilitates discourse, which is why it is used here.

To compensate for this digression, let me show you a graph, which pretty much summarizes the "punch line" of this post. The graph below shows the omega-6 fat contents of 1 lb (454 g) of grain-fed beef and 1 tablespoon (roughly 14 g) of a typical industrial vegetable oil (safflower oil, of the high linoleic acid variety). As you can see, there is a lot more omega-6 in the much smaller amount of industrial vegetable oil. A gram-for-gram comparison would practically make the beef content bar disappear.


It has been estimated that our Paleolithic ancestors consumed a diet with an omega-6 to omega-3 ratio of about 1. While other estimates exist, the general consensus seems to be that that ratio was not much greater than 5. Western diets, in contrast, typically have omega-6 to omega-3 ratios of between 15 and 40. In some cases, the ratio is even higher.

Omega-6 fats are essential fats, meaning that they must be part of one’s diet. Fats make up about 60 percent of our brain. About 20 percent is made up of omega-6 and omega-3 fats. The primary omega-6 fat found in our brain is arachidonic acid, which is either synthesized by our body based on linoleic acid from plant foods or obtained directly from animal foods such as meat and eggs. The predominant omega-3 fat found in our brain is docosahexaenoic acid (DHA), of which certain types of fish and algae are rich sources.

Inflammation is an important process in the human body, without which wounds would never heal. Incidentally, muscle gain would not occur without inflammation either. Strength training causes muscle damage and inflammation, after which recovery leads to muscle gain. Omega-6 fats play an important role in inflammation. Generally, they are pro-inflammatory.

Too much inflammation, particularly in a chronic fashion, is believed to be very detrimental to our health. A very high omega-6 to omega-3 ratio seems to cause excessive and chronic inflammation. The reason is that omega-3 fats are generally anti-inflammatory, counteracting the pro-inflammatory action of omega-6 fats. Over time, a very high omega-6 to omega-3 ratio is believed to cause a number of Western diseases. Among them are cardiovascular complications, cancer, and various autoimmune diseases.

So, should you worry about too much omega-6 from grain-fed meats?

If you think that the answer is “yes”, consider this. Apparently the (arguably) longest-living group in the world, the non-Westernized Okinawans, consume plenty of pork. Pork is a staple of their traditional diet. It is true that the average cut will have an omega-6 to omega-3 ratio of more than 7, which is not very favorable. Pork in general, whether grain-fed or not, is relatively high in omega-6 fats. As a side note, pork is not a good source of linoleic acid (found in plants), even though it is a rich source of arachidonic acid, the omega-6 fat synthesized from linoleic acid by various animals.

It is difficult to estimate the exact amounts of omega-6 and omega-3 fats from grain-fed cuts of meat; different sources provide different estimates. Here are some reasonable estimates based on various sources, including Nutritiondata.com. A typical 100 g portion of grain-fed pork should contain about 690 mg of omega-6 fats, and 120 mg of omega-3 fats. A typical 100 g portion of grain-fed beef should have about 234 mg of omega-6 fats, and 12 mg of omega-3 fats. It does not take that much omega-3 to counterbalance the omega-6 obtained from grain-fed pork or beef, even if one eats a lot of them. Two softgels of fish oil will normally contain about 720 mg of omega-3 fats (they will also come with 280 mg of omega-6 fats). Three sardines will have over 2 g of omega-3 fats, and less than 200 mg of omega-6 fats.

Industrial vegetable oils (made from, e.g., safflower seeds, soybean, and sunflower seeds) are very, very rich sources of omega-6 fats, in the form of linoleic acid. There is a lot more omega-6 in them than in grain-fed meats. One tablespoon of safflower oil contains over 10 g of omega-6 fats, in the form of linoleic acid, and virtually zero omega-3 fats. About 2 kg (4.4 lbs) of grain-fed pork, and 5 kg (11 lbs) of grain-fed beef will give you that much omega-6; but they will also come with omega-3.

How much fish oil does one need to neutralize 10 g of pure omega-6 fats? A lot! And there is a problem. Excessive fish oil consumption may be toxic to the liver.

If you cook with industrial vegetable oils rich in linoleic acid (this excludes olive and coconut oils), or eat out a lot in restaurants that use them (the vast majority), you will probably be consuming significantly more than 10 g of omega-6 fats per day. The likely negative health effects of eating grain-fed meats pales in comparison with the likely negative health effects of this much omega-6 fats from industrial vegetable oils.

You should reduce as much as possible your consumption of industrial vegetable oils rich in linoleic acid, as well as other products that use them (e.g., margarine). Keep in mind that industrial vegetable oils are in many, many industrialized foods; even canned sardines, if they are canned with soybean oil.

It is also advisable to couple this with moderate consumption of fish rich in omega-3, such as sardines and salmon. (See this post for a sardine recipe.) Taking large doses of fish oil every day may not be such a good idea.

Should you also consume only grass-fed meat? Do it if you can. But, if you cannot, maybe you shouldn’t worry too much about it. This also applies to eggs, dairy, and other animal products.

References:

Elliott, W.H., & Elliott, D.C. (2009). Biochemistry and molecular biology. New York: NY: Oxford University Press.

Ramsden, C.E., Faurot, K.R., Carrera-Bastos, P., Cordain, L., De Lorgeril, M., & Sperling (2009). Dietary fat quality and coronary heart disease prevention: A unified theory based on evolutionary, historical, global, and modern perspectives. Current Treatment Options in Cardiovascular Medicine, 11(4), 289-301.

Schmidt, M.A. (1997). Smart fats: How dietary fats and oils affect mental, physical and emotional intelligence. Berkeley, CA: North Atlantic Books.

Saturday, June 23, 2018

38 g of sardines or 2 fish oil softgels? Let us look at the numbers

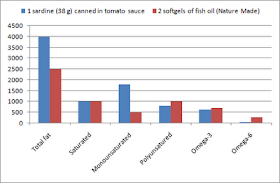
The bar chart below shows the fat content of 1 sardine (38 g) canned in tomato sauce, and 2 fish oil softgels of the Nature Made brand. (The sardine is about 1/3 of the content of a typical can, and the data is from Nutritiondata.com. The two softgels are listed as the “serving size” on the Nature Made bottle.) Both the sardine and softgels have some vegetable oil added; presumably to increase their vitamin E content and form a more stable oil mix. This chart is a good reminder that looking at actual numbers can be quite instructive sometimes. Even though the chart focuses on fat content, it is worth noting that the 38 g sardine also contains 8 g of high quality protein.


If your goal with the fish oil is to “neutralize” the omega-6 fat content of your diet, which is most people’s main goal, you should consider this. A rough measure of the omega-6 neutralization “power” of a food portion is, by definition, its omega-3 minus omega-6 content. For the 1 canned sardine, this difference is 596 mg; for the 2 fish oil softgels, 440 mg. The reason is that the two softgels have more omega-6 than the sardine.

In case you are wondering, the canning process does not seem to have much of an effect on the nutrient composition of the sardine. There is some research suggesting that adding vegetable oil (e.g., soy) helps preserve the omega-3 content during the canning process. There is also research suggesting that not much is lost even without any vegetable oil being added.

Fish oil softgels, when taken in moderation (e.g., two of the type discussed in this post, per day), are probably okay as “neutralizers” of omega-6 fats in the diet, and sources of a minimum amount of omega-3 fats for those who do not like seafood. For those who can consume 1 canned sardine per day, which is only 1/3 of a typical can of sardines, the sardine is not only a more effective source of omega-3, but also a good source of protein and many other nutrients.

As far as balancing dietary omega-6 fats is concerned, you are much better off reducing your consumption of foods rich in omega-6 fats in the first place. Apparently nothing beats avoiding industrial seed oils in that respect. It is also advisable to eat certain types of nuts with high omega-6 content, like walnuts, in moderation.

Both omega-6 and omega-3 fats are essential; they must be part of one’s diet. The actual minimum required amounts are fairly small, probably much lower than the officially recommended amounts. Chances are they would be met by anyone on a balanced diet of whole foods. Too much of either type of fat in synthetic or industrialized form can cause problems. A couple of instructive posts on this topic are this post by Chris Masterjohn, and this one by Chris Kresser.

Even if you don’t like canned sardines, it is not much harder to gulp down 38 g of sardines than it is to gulp down 2 fish oil softgels. You can get the fish oil for $12 per bottle with 300 softgels; or 8 cents per serving. You can get a can of sardines for 50 cents; which gives 16.6 cents per serving. The sardine is twice as expensive, but carries a lot more nutritional value.

You can also buy wild caught sardines, like I do. I also eat canned sardines. Wild caught sardines cost about $2 per lb, and are among the least expensive fish variety. They are not difficult to prepare; see this post for a recipe.

I don’t know how many sardines go into the industrial process of making 2 fish oil softgels, but I suspect that it is more than one. So it is also probably more ecologically sound to eat the sardine.

Monday, May 28, 2018

Moderate alcohol consumption’s benefits: Blood flow or hormesis?


Moderate alcohol consumption has been found again and again to be beneficial to health (, , ). Even somewhat pessimistic studies linking alcohol consumption with health suggest that 6 drinks per week is optimal (). One drink is generally defined as: a 4-ounce glass of wine, a 12-ounce bottle or can of beer, or a 1.5-ounce shot of hard liquor. The amounts of ethanol vary, with more in hard liquor: 4 ounces of wine = 10.8 g of ethanol, 12 ounces of beer = 13.2 g of ethanol, and 1.5 ounces of spirits = 15.1 g of ethanol.

Contrary to popular belief, the positive health effects of moderate alcohol consumption have little, if anything, to do with polyphenols such as resveratrol. It is in fact the ethanol content that leads to the positive effects, apparently reducing the incidence of coronary heart disease, diabetes, hypertension, congestive heart failure, stroke, dementia, Raynaud’s phenomenon, and all-cause mortality. Raynaud's phenomenon is associated with poor circulation in the extremities (e.g., toes, fingers), which in some cases can progress to gangrene.

Two main explanations for the positive health effects of moderate alcohol consumption are: (a) that it improves blood flow; and (b) that it improves liver function via hormesis. These two explanations are not mutually exclusive and may both be right. The latter explanation is based on the assumption that often a favorable biological response results from low exposures to toxins and other stressors. This is fundamentally a compensatory adaptation response ().

It is not very easy to find evidence in favor of the first explanation above – that moderate alcohol consumption improves blood flow. An old study by Fewings and colleagues is a welcome exception. The study was published in 1966 in the British Journal of Pharmacology. It is titled: “The effects of ethyl alcohol on the blood vessels of the hand and forearm in man” ().

The figure below, from the study, shows average measures for 5 people who consumed 100 ml of brandy. This is equivalent to about 2 drinks. Each set of points reflects measurements taken at 30-minute intervals. The top graph shows the variation in blood alcohol content over time in mg / 100 ml. The middle graph shows the variation in hand blood flow over time in what the authors reported to be ml / 100 ml / min. The bottom graph shows the variation in forearm blood flow over time in the same scale as hand blood flow.


Many other measures are reported by the authors of the study, including measures in response to direct intra-arterial injection of ethanol. When injected, ethanol appears to have a nonlinear effect, opposite to that of oral consumption at first. Injected ethanol seems to impair blood flow at first, and then improve it significantly after a while.

Oral ethanol intake, through drinking alcoholic beverages, is the main focus of this post.

The authors also show evidence that the improvement in blood flow maintains itself for more than 2 h, and that flow becomes impaired at very high levels of blood alcohol.

So, as we can see, moderate alcohol consumption seems to improve blood flow. Why would this enhance one’s health?

One reason is that many important chemicals flow through the blood, which is about 90 percent water. Among these chemicals are free fatty acids, glucose, vitamins, minerals and oxygen. Without these chemicals, organs cannot operate properly, and in fact their tissues may die rather quickly. For example, for normal function the brain requires 3.3 ml / min of oxygen per 100 g of brain mass.

Another reason is that impaired blood flow seems to be significantly associated with accelerated atherosclerotic plaque growth, via a phenomenon known as endothelial cell apoptosis ().

Wednesday, April 25, 2018

Alcohol consumption, mortality, and cardiovascular disease


The graphs below summarize key results from a study published in April of 2018 by the highly influential journal The Lancet (). The study reported having included at least 599,912 drinkers in the analysis and having recorded 40,310 deaths and 39,018 cardiovascular disease events. The authors of the study concluded that “For all-cause mortality, we recorded a positive and curvilinear association with the level of alcohol consumption, with the minimum mortality risk around or below 100 g per week.


The study was presented as being somewhat pessimistic: one cannot drink as much as previous data suggested. Let’s see. Two drinks of a spirit (e.g., whiskey) served “neat” (i.e., with nothing added to it) will typically add up to about 84 g; or 3 oz. If the alcohol content is 40 percent, such a double drink will contain about 33 g of alcohol. So, according to this study, you can still enjoy three double drinks of spirit per week, or six single drinks – which is almost one per day. That is not so little.

This study is consistent with most studies of the effect of alcohol consumption on health, which generally show results in terms of averages within fixed ranges of consumption. For example, they will show average mortality risks for people consuming 1, 2, 3 etc. drinks per day. These studies suggest that there is a J-curve relationship between alcohol consumption and health. That is, drinking a little is better than not drinking; and drinking a lot is worse than drinking a little.

Contrary to popular belief, the positive health effects of moderate alcohol consumption have little, if anything, to do with polyphenols such as resveratrol. Resveratrol, once believed to be the fountain of youth, is found in the skin of red grapes.

It is in fact the alcohol content that has positive effects, apparently reducing the incidence of coronary heart disease, diabetes, hypertension, congestive heart failure, stroke, dementia, Raynaud’s phenomenon, and all-cause mortality. Raynaud's phenomenon is associated with poor circulation in the extremities (e.g., toes, fingers), which in some cases can progress to gangrene.

In most studies of the effects of alcohol consumption on health, the J-curves emerge from visual inspection of the plots of averages across ranges of consumption. Rarely you find studies where nonlinear relationships are “discovered” by software tools such as WarpPLS (), with effects being adjusted accordingly.

Still, this study is indeed consistent with some past studies suggesting that the amount of alcohol intake that is optimal maybe less than most of us think ().

Sunday, February 25, 2018

Baked cod and lobster


Many years ago I lost 60 lbs (27 kg) over a period of about 2-3 years, and kept it off. Often people are surprised when I show them an old picture of myself, where I am visibly obese ().

I have always felt that one of the keys to losing a significant amount of body fat without triggering body starvation responses is to eat a diet that has a high nutrient-to-calorie ratio. The baked cod and lobster dish below, with photos before and after baking, is a good example of a meal in such a diet.


This is a fairly simple meal to prepare; simple and delicious. The cost of this dish goes down significantly if you do not include the lobster. Below is a recipe. I used it to prepare the baked cod and lobster shown on the photos above.

- Cut and spread on two sheet pans about 4 tomatoes, 1 cup of onion, 1 cup of spinach, 2 lbs of cod, and 4 lobster tails (approx. 4 oz each).

- Add some butter to the mix. I recommend more butter on the lobster than on the cod.

- Preheat the oven to 350 degrees Fahrenheit.

- Add seasoning to taste. I suggest using a small amount of salt, and some chili powder, garlic powder, cayenne pepper, and herbs.

- Bake for about 30 minutes, or until the lobster is soft.

Let us say you are hungry, so you eat about one-fourth of all of this. That is one lobster tail and about a quarter of the cod dish. The nutrition content of such a meal is shown below.


So you will be getting about 86 g of protein in this one single meal. The vitamins and mineral contents listed are mostly above 100 percent of the usually recommended intake. All of this while taking in only a little over 500 calories.

It is very difficult to get fat eating like this!