Ketones are compounds that have a specific chemical structure. The figure below (from: Wikipedia) shows the chemical structure of various types of ketones. As you can see, all ketones share a carbonyl group; that is the “O=” part of their chemical structure. A carbonyl group is an oxygen atom double-bonded to a carbon atom.
Technically speaking, many substances can be classified as ketones. Not all of these are involved in the same metabolic processes in humans. For example, fructose is technically a ketone, but it is not one of the three main ketones produced by humans from dietary macronutrients (discussed below), and is not metabolized in the same way as are those three main ketones.
Humans, as well as most other vertebrates, produce three main ketones (also known as ketone bodies) from dietary macronutrients. These are acetone, acetoacetate and beta-hydroxybutyrate. Low carbohydrate diets tend to promote glycogen depletion, which in turn leads to increased production of these ketones. Glycogen is stored in the liver and muscles. Liver glycogen is used by the body to maintain blood glucose levels within a narrow range in the fasted state. Examples of diets that tend to promote glycogen depletion are the Atkins Diet and Kwaśniewski’s Optimal Diet.
A search for articles on ketosis in scientific databases usually returns a large number of articles dealing with ketosis in cows. Why? The reason is that ketosis reduces milk production, by both reducing the amount of fat and glucose available for milk synthesis. In fact, ketosis is referred to as a “disease” in cows.
In humans, most articles on ketosis refer to pathological ketosis (a.k.a. ketoacidosis), especially in the context of uncontrolled diabetes. One notable exception is an article by Williamson (2005), from which the table below was taken. The table shows ketone concentrations in the blood under various circumstances, in mmol/l.
As you can see, relatively high concentrations of ketones occur in newborn babies (neonate), in adults post-exercise, and in adults fed a high fat diet. Generally speaking, a high fat diet is a low carbohydrate diet, and a high carbohydrate diet is a low fat diet. (One occasionally sees diets that are high in both carbohydrates and fat; which seem excellent at increasing body fat and thus reducing life span. This diet is apparently popular among sumo wrestlers, where genetics and vigorous exercise usually counter the negative diet effects.)
Situations in which ketosis occurs in newborn babies (neonate), in adults post-exercise, and in adults fed a high fat diet are all examples of physiological, or benign, ketosis. Ketones are also found in low concentrations in adults fed a standard American diet.
Ketones are found in very high concentrations in adults with untreated diabetes. This is an example of pathological ketosis, even though ketones are produced as part of a protective compensatory mechanism to spare glucose for the brain and red blood cells (which need glucose to function properly). Pathological ketosis leads to serum ketone levels that can be as much as 80 times (or more) those found in physiological ketosis.
Serum ketone concentrations increase proportionally to decreases in stored glycogen and, when glycogen is low or absent, correlate strongly (and inversely) with blood glucose levels. In some individuals glycogen is practically absent due to a genetic condition that leads to hepatic glycogen synthase deficiency. This is a deficiency of the enzyme that promotes glycogen synthesis by the liver. The figure below (also from Williamson, 2005) shows the variations in glucose and ketone levels in a child with glycogen synthase deficiency.
What happened with this child? Williamson answers this question: “It is of interest that this particular child suffered no ill effects from the daily exposure to high concentrations of ketone bodies, underlining their role as normal substrates for the brain when available.”
Unlike glucose and lipoprotein-bound fats (in VLDL, for example), unused ketones cannot be converted back to substances that can be stored by the body. Thus excess ketones are eliminated in the urine; leading to their detection by various tests, e.g., Ketostix tests. This elimination of unused ketones in the urine is one of the reasons why low carbohydrate diets are believed to lead to enhanced body fat loss.
In summary, ketones are present in the blood most of the time, in most people, whether they are on a ketogenic diet or not. If they do not show up in the urine, it does not mean that they are not present in the blood; although it usually means that their concentration in the blood is not that high. Like glucose, ketones are soluble in water, and thus circulate in the blood without the need for carriers (e.g., albumin, which is needed for the transport of free fatty acids; and VLDL, needed for the transport of triglycerides). Like glucose, they are used as sources of energy by the brain and by muscle tissues.
It has been speculated that ketosis leads to accelerated aging, through the formation of advanced glycation endproducts (AGEs), a speculation that seems to be largely unfounded (see this post). It is difficult to believe that a metabolic process that is universally found in babies and adults post-exercise would have been favored by evolution if it led to accelerated aging.
References:
Williamson, D.H. (2005). Ketosis. Encyclopedia of Human Nutrition, 91-98.
Tuesday, May 26, 2020
Wednesday, April 15, 2020
Herd immunity
The figure below is adapted from an article published in 2011 by Fine and colleagues (). The article discusses the concept of “herd immunity”: individuals with immunity against a disease act as a “shield” for the community, slowing or stopping the spread of the disease.
At the top of the figure, the number of infected individuals grows exponentially, until a certain number of individuals with immunity is achieved. At the bottom of the figure, those with immunity “absorb and kill” the infectious agent, without passing it forward – significantly limiting the progression of the disease.
This illustrates the likely impact of vaccination in cases where immunity being acquired through full infection is problematic, such as with COVID-19. In these cases, vaccination would slow or stop the spread of the disease, even if only a proportion of the community is vaccinated.
That is, until the infectious agent mutates!
Wednesday, April 1, 2020
China’s relaxing of COVID-19 social distancing policy after containment appears to have worked
The graphs below summarize key results from a study published in early 2020 by Ainslie and colleagues (). Dr. Ainslie is in the Faculty of Medicine, School of Public Health, Imperial College London. The study looked at within-city movement, as a proxy for economic activity, and how that movement has influenced the numbers of new cases of COVID-19 in various areas, after initial containment.
As you can see, after initial containment is achieved, within-city movement (measured through a “Movement Index”) seems to be uncorrelated with new COVID-19 cases; or somewhat negatively correlated, as the authors note.
This surprising and counterintuitive outcome may be due to people becoming much more cautious about social interactions.
Monday, October 21, 2019
Lipotoxicity or tired pancreas? Abnormal fat metabolism as a possible precondition for type 2 diabetes
The term “diabetes” is used to describe a wide range of diseases of glucose metabolism; diseases with a wide range of causes. The diseases include type 1 and type 2 diabetes, type 2 ketosis-prone diabetes (which I know exists thanks to Michael Barker’s blog), gestational diabetes, various MODY types, and various pancreatic disorders. The possible causes include genetic defects (or adaptations to very different past environments), autoimmune responses, exposure to environmental toxins, as well as viral and bacterial infections; in addition to obesity, and various other apparently unrelated factors, such as excessive growth hormone production.
Type 2 diabetes and the “tired pancreas” theory
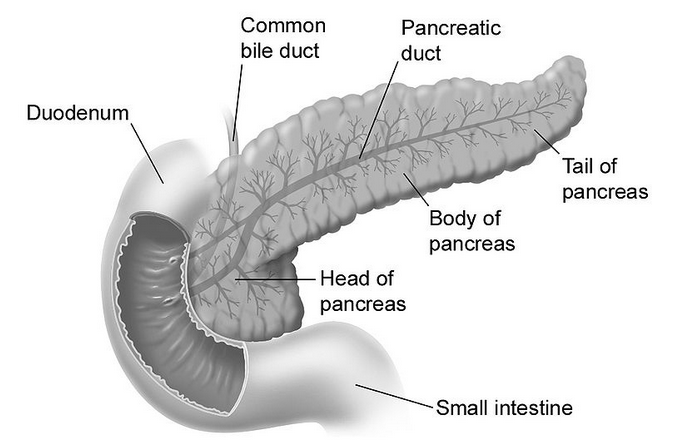
Type 2 diabetes is the one most commonly associated with the metabolic syndrome, which is characterized by middle-age central obesity, and the “diseases of civilization” brought up by Neolithic inventions. Evidence is mounting that a Neolithic diet and lifestyle play a key role in the development of the metabolic syndrome. In terms of diet, major suspects are engineered foods rich in refined carbohydrates and refined sugars. In this context, one widely touted idea is that the constant insulin spikes caused by consumption of those foods lead the pancreas (figure below from Wikipedia) to get “tired” over time, losing its ability to produce insulin. The onset of insulin resistance mediates this effect.
Empirical evidence against the “tired pancreas” theory
This “tired pancreas” theory, which refers primarily to the insulin-secreting beta-cells in the pancreas, conflicts with a lot of empirical evidence. It is inconsistent with the existence of isolated semi/full hunter-gatherer groups (e.g., the Kitavans) that consume large amounts of natural (i.e., unrefined) foods rich in easily digestible carbohydrates from tubers and fruits, which cause insulin spikes. These groups are nevertheless generally free from type 2 diabetes. The “tired pancreas” theory conflicts with the existence of isolated groups in China and Japan (e.g., the Okinawans) whose diets also include a large proportion of natural foods rich in easily digestible carbohydrates, which cause insulin spikes. Yet these groups are generally free from type 2 diabetes.
Humboldt (1995), in his personal narrative of his journey to the “equinoctial regions of the new continent”, states on page 121 about the natives as a group that: "… between twenty and fifty years old, age is not indicated by wrinkling skin, white hair or body decrepitude [among natives]. When you enter a hut is hard to differentiate a father from son …" A large proportion of these natives’ diets included plenty of natural foods rich in easily digestible carbohydrates from tubers and fruits, which cause insulin spikes. Still, there was no sign of any condition that would suggest a prevalence of type 2 diabetes among them.
At this point it is important to note that the insulin spikes caused by natural carbohydrate-rich foods are much less pronounced than the ones caused by refined carbohydrate-rich foods. The reason is that there is a huge gap between the glycemic loads of natural and refined carbohydrate-rich foods, even though the glycemic indices may be quite similar in some cases. Natural carbohydrate-rich foods are not made mostly of carbohydrates. Even an Irish (or white) potato is 75 percent water.
More insulin may lead to abnormal fat metabolism in sedentary people
The more pronounced spikes may lead to abnormal fat metabolism because more body fat is force-stored than it would have been with the less pronounced spikes, and stored body fat is not released just as promptly as it should be to fuel muscle contractions and other metabolic processes. Typically this effect is a minor one on a daily basis, but adds up over time, leading to fairly unnatural patterns of fat metabolism in the long run. This is particularly true for those who lead sedentary lifestyles. As for obesity, nobody gets obese in one day. So the key problem with the more pronounced spikes may not be that the pancreas is getting “tired”, but that body fat metabolism is not normal, which in turn leads to abnormally high or low levels of important body fat-derived hormones (e.g., high levels of leptin and low levels of adiponectin).
One common characteristic of the groups mentioned above is absence of obesity, even though food is abundant and often physical activity is moderate to low. Repeat for emphasis: “… even though food is abundant and often physical activity is moderate to low”. Note that having low levels of activity is not the same as spending the whole day sitting down in a comfortable chair working on a computer. Obviously caloric intake and level of activity among these groups were/are not at the levels that would lead to obesity. How could that be possible? See this post for a possible explanation.
Excessive body fat gain, lipotoxicity, and type 2 diabetes
There are a few theories that implicate the interaction of abnormal fat metabolism with other factors (e.g., genetic factors) in the development of type 2 diabetes. Empirical evidence suggests that this is a reasonable direction of causality. One of these theories is the theory of lipotoxicity.
Several articles have discussed the theory of lipotoxicity. The article by Unger & Zhou (2001) is a widely cited one. The theory seems to be widely based on the comparative study of various genotypes found in rats. Nevertheless, there is mounting evidence suggesting that the underlying mechanisms may be similar in humans. In a nutshell, this theory proposes the following steps in the development of type 2 diabetes:
(1) Abnormal fat mass gain leads to an abnormal increase in fat-derived hormones, of which leptin is singled out by the theory. Some people seem to be more susceptible than others in this respect, with lower triggering thresholds of fat mass gain. (What leads to exaggerated fat mass gains? The theory does not go into much detail here, but empirical evidence from other studies suggests that major culprits are refined grains and seeds, as well as refined sugars; other major culprits seem to be trans fats, and vegetable oils rich in linoleic acid.)
(2) Resistance to fat-derived hormones sets in. Again, leptin resistance is singled out as the key here. (This is a bit simplistic. Other fat-derived hormones, like adiponectin, seem to clearly interact with leptin.) Since leptin regulates fatty acid metabolism, the theory argues, leptin resistance is hypothesized to impair fatty acid metabolism.
(3) Impaired fat metabolism causes fatty acids to “spill over” to tissues other than fat cells, and also causes an abnormal increase in a substance called ceramide in those tissues. These include tissues in the pancreas that house beta-cells, which secrete insulin. In short, body fat should be stored in fat cells (adipocytes), not outside them.
(4) Initially fatty acid “spill over” to beta-cells enlarges them and makes them become overactive, leading to excessive insulin production in response to carbohydrate-rich foods, and also to insulin resistance. This is the pre-diabetic phase where hypoglycemic episodes happen a few hours following the consumption of carbohydrate-rich foods. Once this stage is reached, several natural carbohydrate-rich foods also become a problem (e.g., potatoes and bananas), in addition to refined carbohydrate-rich foods.
(5) Abnormal levels of ceramide induce beta-cell apoptosis in the pancreas. This is essentially “death by suicide” of beta cells in the pancreas. What follows is full-blown type 2 diabetes. Insulin production is impaired, leading to very elevated blood glucose levels following the consumption of carbohydrate-rich foods, even if they are unprocessed.
It is widely known that type 2 diabetics have impaired glucose metabolism. What is not so widely known is that usually they also have impaired fatty acid metabolism. For example, consumption of the same fatty meal is likely to lead to significantly more elevated triglyceride levels in type 2 diabetics than non-diabetics, after several hours. This is consistent with the notion that leptin resistance precedes type 2 diabetes, and inconsistent with the “tired pancreas” theory.
Weak and strong points of the theory of lipotoxicity
A weakness of the theory of lipotoxicity is its strong lipophobic tone; at least in the articles that I have read. There is ample evidence that eating a lot of the ultra-demonized saturated fat, per se, is not what makes people obese or type 2 diabetic. Yet overconsumption of trans fats and vegetable oils rich in linoleic acid does seem to be linked with obesity and type 2 diabetes. (So does the consumption of refined grains and seeds, and refined sugars.) The theory of lipotoxicity does not seem to make these distinctions.
In defense of the theory of lipotoxicity, it does not argue that there cannot be thin diabetics. Many type 1 diabetics are thin. Type 2 diabetics can also be thin, although this is much less common. In certain individuals, the threshold of body fat gain that will precipitate lipotoxicity may be quite low. In others, the same amount of body fat gain (or more) may in fact increase their insulin sensitivity under certain circumstances – e.g., when growth hormone levels are abnormally low.
Autoimmune disorders, perhaps induced by environmental toxins, or toxins found in certain refined foods, may cause the immune system to attack the beta-cells in the pancreas. This may lead to type 1 diabetes if all beta cells are destroyed, or something that can easily be diagnosed as type 2 (or type 1.5) diabetes if only a portion of the cells are destroyed, in a way that does not involve lipotoxicity.
Nor does the theory of lipotoxicity predict that all those who become obese will develop type 2 diabetes. It only suggests that the probability will go up, particularly if other factors are present (e.g., genetic propensity). There are many people who are obese during most of their adult lives and never develop type 2 diabetes. On the other hand, some groups, like Hispanics, tend to develop type 2 diabetes more easily (often even before they reach the obese level). One only has to visit the South Texas region near the Rio Grande border to see this first hand.
What the theory proposes is a new way of understanding the development of type 2 diabetes; a way that seems to make more sense than the “tired pancreas” theory. The theory of lipitoxicity may not be entirely correct. For example, there may be other mechanisms associated with abnormal fat metabolism and consumption of Neolithic foods that cause beta-cell “suicide”, and that have nothing to do with lipotoxicity as proposed by the theory. (At least one fat-derived hormone, tumor necrosis factor-alpha, is associated with abnormal cell apoptosis when abnormally elevated. Levels of this hormone go up immediately after a meal rich in refined carbohydrates.) But the link that it proposes between obesity and type 2 diabetes seems to be right on target.
Implications and thoughts
Some implications and thoughts based on the discussion above are the following. Some are extrapolations based on the discussion in this post combined with those in other posts. At the time of this writing, there were hundreds of posts on this blog, in addition to many comments stemming from over 2.5 million page views. See under "Labels" at the bottom-right area of this blog for a summary of topics addressed. It is hard to ignore things that were brought to light in previous posts.
- Let us start with a big one: Avoiding natural carbohydrate-rich foods in the absence of compromised glucose metabolism is unnecessary. Those foods do not “tire” the pancreas significantly more than protein-rich foods do. While carbohydrates are not essential macronutrients, protein is. In the absence of carbohydrates, protein will be used by the body to produce glucose to supply the needs of the brain and red blood cells. Protein elicits an insulin response that is comparable to that of natural carbohydrate-rich foods on a gram-adjusted basis (but significantly lower than that of refined carbohydrate-rich foods, like doughnuts and bagels). Usually protein does not lead to a measurable glucose response because glucagon is secreted together with insulin in response to ingestion of protein, preventing hypoglycemia.
- Abnormal fat gain should be used as a general measure of one’s likelihood of being “headed south” in terms of health. The “fitness” level for men and women shown on the table in this post seem like good targets for body fat percentage. The problem here, of course, is that this is not as easy as it sounds. Attempts at getting lean can lead to poor nutrition and/or starvation. These may make matters worse in some cases, leading to hormonal imbalances and uncontrollable hunger, which will eventually lead to obesity. Poor nutrition may also depress the immune system, making one susceptible to a viral or bacterial infection that may end up leading to beta-cell destruction and diabetes. A better approach is to place emphasis on eating a variety of natural foods, which are nutritious and satiating, and avoiding refined ones, which are often addictive “empty calories”. Generally fat loss should be slow to be healthy and sustainable.
- Finally, if glucose metabolism is compromised, one should avoid any foods in quantities that cause an abnormally elevated glucose or insulin response. All one needs is an inexpensive glucose meter to find out what those foods are. The following are indications of abnormally elevated glucose and insulin responses, respectively: an abnormally high glucose level 1 hour after a meal (postprandial hyperglycemia); and an abnormally low glucose level 2 to 4 hours after a meal (reactive hypoglycemia). What is abnormally high or low? Take a look at the peaks and troughs shown on the graph in this post; they should give you an idea. Some insulin resistant people using glucose meters will probably realize that they can still eat several natural carbohydrate-rich foods, but in small quantities, because those foods usually have a low glycemic load (even if their glycemic index is high).
Lucy was a vegetarian and Sapiens an omnivore. We apparently have not evolved to be pure carnivores, even though we can be if the circumstances require. But we absolutely have not evolved to eat many of the refined and industrialized foods available today, not even the ones marketed as “healthy”. Those foods do not make our pancreas “tired”. Among other things, they “mess up” fat metabolism, which may lead to type 2 diabetes through a complex process involving hormones secreted by body fat.
References
Humboldt, A.V. (1995). Personal narrative of a journey to the equinoctial regions of the new continent. New York, NY: Penguin Books.
Unger, R.H., & Zhou, Y.-T. (2001). Lipotoxicity of beta-cells in obesity and in other causes of fatty acid spillover. Diabetes, 50(1), S118-S121.
Type 2 diabetes and the “tired pancreas” theory
Type 2 diabetes is the one most commonly associated with the metabolic syndrome, which is characterized by middle-age central obesity, and the “diseases of civilization” brought up by Neolithic inventions. Evidence is mounting that a Neolithic diet and lifestyle play a key role in the development of the metabolic syndrome. In terms of diet, major suspects are engineered foods rich in refined carbohydrates and refined sugars. In this context, one widely touted idea is that the constant insulin spikes caused by consumption of those foods lead the pancreas (figure below from Wikipedia) to get “tired” over time, losing its ability to produce insulin. The onset of insulin resistance mediates this effect.
Empirical evidence against the “tired pancreas” theory
This “tired pancreas” theory, which refers primarily to the insulin-secreting beta-cells in the pancreas, conflicts with a lot of empirical evidence. It is inconsistent with the existence of isolated semi/full hunter-gatherer groups (e.g., the Kitavans) that consume large amounts of natural (i.e., unrefined) foods rich in easily digestible carbohydrates from tubers and fruits, which cause insulin spikes. These groups are nevertheless generally free from type 2 diabetes. The “tired pancreas” theory conflicts with the existence of isolated groups in China and Japan (e.g., the Okinawans) whose diets also include a large proportion of natural foods rich in easily digestible carbohydrates, which cause insulin spikes. Yet these groups are generally free from type 2 diabetes.
Humboldt (1995), in his personal narrative of his journey to the “equinoctial regions of the new continent”, states on page 121 about the natives as a group that: "… between twenty and fifty years old, age is not indicated by wrinkling skin, white hair or body decrepitude [among natives]. When you enter a hut is hard to differentiate a father from son …" A large proportion of these natives’ diets included plenty of natural foods rich in easily digestible carbohydrates from tubers and fruits, which cause insulin spikes. Still, there was no sign of any condition that would suggest a prevalence of type 2 diabetes among them.
At this point it is important to note that the insulin spikes caused by natural carbohydrate-rich foods are much less pronounced than the ones caused by refined carbohydrate-rich foods. The reason is that there is a huge gap between the glycemic loads of natural and refined carbohydrate-rich foods, even though the glycemic indices may be quite similar in some cases. Natural carbohydrate-rich foods are not made mostly of carbohydrates. Even an Irish (or white) potato is 75 percent water.
More insulin may lead to abnormal fat metabolism in sedentary people
The more pronounced spikes may lead to abnormal fat metabolism because more body fat is force-stored than it would have been with the less pronounced spikes, and stored body fat is not released just as promptly as it should be to fuel muscle contractions and other metabolic processes. Typically this effect is a minor one on a daily basis, but adds up over time, leading to fairly unnatural patterns of fat metabolism in the long run. This is particularly true for those who lead sedentary lifestyles. As for obesity, nobody gets obese in one day. So the key problem with the more pronounced spikes may not be that the pancreas is getting “tired”, but that body fat metabolism is not normal, which in turn leads to abnormally high or low levels of important body fat-derived hormones (e.g., high levels of leptin and low levels of adiponectin).
One common characteristic of the groups mentioned above is absence of obesity, even though food is abundant and often physical activity is moderate to low. Repeat for emphasis: “… even though food is abundant and often physical activity is moderate to low”. Note that having low levels of activity is not the same as spending the whole day sitting down in a comfortable chair working on a computer. Obviously caloric intake and level of activity among these groups were/are not at the levels that would lead to obesity. How could that be possible? See this post for a possible explanation.
Excessive body fat gain, lipotoxicity, and type 2 diabetes
There are a few theories that implicate the interaction of abnormal fat metabolism with other factors (e.g., genetic factors) in the development of type 2 diabetes. Empirical evidence suggests that this is a reasonable direction of causality. One of these theories is the theory of lipotoxicity.
Several articles have discussed the theory of lipotoxicity. The article by Unger & Zhou (2001) is a widely cited one. The theory seems to be widely based on the comparative study of various genotypes found in rats. Nevertheless, there is mounting evidence suggesting that the underlying mechanisms may be similar in humans. In a nutshell, this theory proposes the following steps in the development of type 2 diabetes:
(1) Abnormal fat mass gain leads to an abnormal increase in fat-derived hormones, of which leptin is singled out by the theory. Some people seem to be more susceptible than others in this respect, with lower triggering thresholds of fat mass gain. (What leads to exaggerated fat mass gains? The theory does not go into much detail here, but empirical evidence from other studies suggests that major culprits are refined grains and seeds, as well as refined sugars; other major culprits seem to be trans fats, and vegetable oils rich in linoleic acid.)
(2) Resistance to fat-derived hormones sets in. Again, leptin resistance is singled out as the key here. (This is a bit simplistic. Other fat-derived hormones, like adiponectin, seem to clearly interact with leptin.) Since leptin regulates fatty acid metabolism, the theory argues, leptin resistance is hypothesized to impair fatty acid metabolism.
(3) Impaired fat metabolism causes fatty acids to “spill over” to tissues other than fat cells, and also causes an abnormal increase in a substance called ceramide in those tissues. These include tissues in the pancreas that house beta-cells, which secrete insulin. In short, body fat should be stored in fat cells (adipocytes), not outside them.
(4) Initially fatty acid “spill over” to beta-cells enlarges them and makes them become overactive, leading to excessive insulin production in response to carbohydrate-rich foods, and also to insulin resistance. This is the pre-diabetic phase where hypoglycemic episodes happen a few hours following the consumption of carbohydrate-rich foods. Once this stage is reached, several natural carbohydrate-rich foods also become a problem (e.g., potatoes and bananas), in addition to refined carbohydrate-rich foods.
(5) Abnormal levels of ceramide induce beta-cell apoptosis in the pancreas. This is essentially “death by suicide” of beta cells in the pancreas. What follows is full-blown type 2 diabetes. Insulin production is impaired, leading to very elevated blood glucose levels following the consumption of carbohydrate-rich foods, even if they are unprocessed.
It is widely known that type 2 diabetics have impaired glucose metabolism. What is not so widely known is that usually they also have impaired fatty acid metabolism. For example, consumption of the same fatty meal is likely to lead to significantly more elevated triglyceride levels in type 2 diabetics than non-diabetics, after several hours. This is consistent with the notion that leptin resistance precedes type 2 diabetes, and inconsistent with the “tired pancreas” theory.
Weak and strong points of the theory of lipotoxicity
A weakness of the theory of lipotoxicity is its strong lipophobic tone; at least in the articles that I have read. There is ample evidence that eating a lot of the ultra-demonized saturated fat, per se, is not what makes people obese or type 2 diabetic. Yet overconsumption of trans fats and vegetable oils rich in linoleic acid does seem to be linked with obesity and type 2 diabetes. (So does the consumption of refined grains and seeds, and refined sugars.) The theory of lipotoxicity does not seem to make these distinctions.
In defense of the theory of lipotoxicity, it does not argue that there cannot be thin diabetics. Many type 1 diabetics are thin. Type 2 diabetics can also be thin, although this is much less common. In certain individuals, the threshold of body fat gain that will precipitate lipotoxicity may be quite low. In others, the same amount of body fat gain (or more) may in fact increase their insulin sensitivity under certain circumstances – e.g., when growth hormone levels are abnormally low.
Autoimmune disorders, perhaps induced by environmental toxins, or toxins found in certain refined foods, may cause the immune system to attack the beta-cells in the pancreas. This may lead to type 1 diabetes if all beta cells are destroyed, or something that can easily be diagnosed as type 2 (or type 1.5) diabetes if only a portion of the cells are destroyed, in a way that does not involve lipotoxicity.
Nor does the theory of lipotoxicity predict that all those who become obese will develop type 2 diabetes. It only suggests that the probability will go up, particularly if other factors are present (e.g., genetic propensity). There are many people who are obese during most of their adult lives and never develop type 2 diabetes. On the other hand, some groups, like Hispanics, tend to develop type 2 diabetes more easily (often even before they reach the obese level). One only has to visit the South Texas region near the Rio Grande border to see this first hand.
What the theory proposes is a new way of understanding the development of type 2 diabetes; a way that seems to make more sense than the “tired pancreas” theory. The theory of lipitoxicity may not be entirely correct. For example, there may be other mechanisms associated with abnormal fat metabolism and consumption of Neolithic foods that cause beta-cell “suicide”, and that have nothing to do with lipotoxicity as proposed by the theory. (At least one fat-derived hormone, tumor necrosis factor-alpha, is associated with abnormal cell apoptosis when abnormally elevated. Levels of this hormone go up immediately after a meal rich in refined carbohydrates.) But the link that it proposes between obesity and type 2 diabetes seems to be right on target.
Implications and thoughts
Some implications and thoughts based on the discussion above are the following. Some are extrapolations based on the discussion in this post combined with those in other posts. At the time of this writing, there were hundreds of posts on this blog, in addition to many comments stemming from over 2.5 million page views. See under "Labels" at the bottom-right area of this blog for a summary of topics addressed. It is hard to ignore things that were brought to light in previous posts.
- Let us start with a big one: Avoiding natural carbohydrate-rich foods in the absence of compromised glucose metabolism is unnecessary. Those foods do not “tire” the pancreas significantly more than protein-rich foods do. While carbohydrates are not essential macronutrients, protein is. In the absence of carbohydrates, protein will be used by the body to produce glucose to supply the needs of the brain and red blood cells. Protein elicits an insulin response that is comparable to that of natural carbohydrate-rich foods on a gram-adjusted basis (but significantly lower than that of refined carbohydrate-rich foods, like doughnuts and bagels). Usually protein does not lead to a measurable glucose response because glucagon is secreted together with insulin in response to ingestion of protein, preventing hypoglycemia.
- Abnormal fat gain should be used as a general measure of one’s likelihood of being “headed south” in terms of health. The “fitness” level for men and women shown on the table in this post seem like good targets for body fat percentage. The problem here, of course, is that this is not as easy as it sounds. Attempts at getting lean can lead to poor nutrition and/or starvation. These may make matters worse in some cases, leading to hormonal imbalances and uncontrollable hunger, which will eventually lead to obesity. Poor nutrition may also depress the immune system, making one susceptible to a viral or bacterial infection that may end up leading to beta-cell destruction and diabetes. A better approach is to place emphasis on eating a variety of natural foods, which are nutritious and satiating, and avoiding refined ones, which are often addictive “empty calories”. Generally fat loss should be slow to be healthy and sustainable.
- Finally, if glucose metabolism is compromised, one should avoid any foods in quantities that cause an abnormally elevated glucose or insulin response. All one needs is an inexpensive glucose meter to find out what those foods are. The following are indications of abnormally elevated glucose and insulin responses, respectively: an abnormally high glucose level 1 hour after a meal (postprandial hyperglycemia); and an abnormally low glucose level 2 to 4 hours after a meal (reactive hypoglycemia). What is abnormally high or low? Take a look at the peaks and troughs shown on the graph in this post; they should give you an idea. Some insulin resistant people using glucose meters will probably realize that they can still eat several natural carbohydrate-rich foods, but in small quantities, because those foods usually have a low glycemic load (even if their glycemic index is high).
Lucy was a vegetarian and Sapiens an omnivore. We apparently have not evolved to be pure carnivores, even though we can be if the circumstances require. But we absolutely have not evolved to eat many of the refined and industrialized foods available today, not even the ones marketed as “healthy”. Those foods do not make our pancreas “tired”. Among other things, they “mess up” fat metabolism, which may lead to type 2 diabetes through a complex process involving hormones secreted by body fat.
References
Humboldt, A.V. (1995). Personal narrative of a journey to the equinoctial regions of the new continent. New York, NY: Penguin Books.
Unger, R.H., & Zhou, Y.-T. (2001). Lipotoxicity of beta-cells in obesity and in other causes of fatty acid spillover. Diabetes, 50(1), S118-S121.
Labels:
adiponectin,
body fat,
diabetes,
insulin,
leptin,
lipotoxicity,
tired pancreas theory
Sunday, September 22, 2019
How long does it take for a food-related trait to evolve?
Often in discussions about Paleolithic nutrition, and books on the subject, we see speculations about how long it would take for a population to adapt to a particular type of food. Many speculations are way off mark; some think that even 10,000 years are not enough for evolution to take place.
This post addresses the question: How long does it take for a food-related trait to evolve?
We need a bit of Genetics 101 first, discussed below. For more details see, e.g., Hartl & Clark, 2007; and one of my favorites: Maynard Smith, 1998. Full references are provided at the end of this post.
New gene-induced traits, including traits that affect nutrition, appear in populations through a deceptively simple process. A new genetic mutation appears in the population, usually in one single individual, and one of two things happens: (a) the genetic mutation disappears from the population; or (b) the genetic mutation spreads in the population. Evolution is a term that is generally used to refer to a gene-induced trait spreading in a population.
Traits can evolve via two main processes. One is genetic drift, where neutral traits evolve by chance. This process dominates in very small populations (e.g., 50 individuals). The other is selection, where fitness-enhancing traits evolve by increasing the reproductive success of the individuals that possess them. Fitness, in this context, is measured as the number of surviving offspring (or grand-offspring) of an individual.
Yes, traits can evolve by chance, and often do so in small populations.
Say a group of 20 human ancestors became isolated for some reason; e.g., traveled to an island and got stranded there. Let us assume that the group had the common sense of including at least a few women in it; ideally more than men, because women are really the reproductive bottleneck of any population.
In a new generation one individual develops a sweet tooth, which is a neutral mutation because the island has no supermarket. Or, what would be more likely, one of the 20 individuals already had that mutation prior to reaching the island. (Genetic variability is usually high among any group of unrelated individuals, so divergent neutral mutations are usually present.)
By chance alone, that new trait may spread to the whole (larger now) population in 80 generations, or around 1,600 years; assuming a new generation emerging every 20 years. That whole population then grows even further, and gets somewhat mixed up with other groups in a larger population (they find a way out of the island). The descendants of the original island population all have a sweet tooth. That leads to increased diabetes among them, compared with other groups. They find out that the problem is genetic, and wonder how evolution could have made them like that.
The panel below shows the formulas for the calculation of the amount of time it takes for a trait to evolve to fixation in a population. It is taken from a set of slides I used in a presentation (PowerPoint file here). To evolve to fixation means to spread to all individuals in the population. The results of some simulations are also shown. For example, a trait that provides a minute selective advantage of 1% in a population of 10,000 individuals will possibly evolve to fixation in 1,981 generations, or 39,614 years. Not the millions of years often mentioned in discussions about evolution.
I say “possibly” above because traits can also disappear from a population by chance, and often do so at the early stages of evolution, even if they increase the reproductive success of the individuals that possess them. For example, a new beneficial metabolic mutation appears, but its host fatally falls off a cliff by accident, contracts an unrelated disease and dies etc., before leaving any descendant.
How come the fossil record suggests that evolution usually takes millions of years? The reason is that it usually takes a long time for new fitness-enhancing traits to appear in a population. Most genetic mutations are either neutral or detrimental, in terms of reproductive success. It also takes time for the right circumstances to come into place for genetic drift to happen – e.g., massive extinctions, leaving a few surviving members. Once the right elements are in place, evolution can happen fast.
So, what is the implication for traits that affect nutrition? Or, more specifically, can a population that starts consuming a particular type of food evolve to become adapted to it in a short period of time?
The answer is yes. And that adaptation can take a very short amount of time to happen, relatively speaking.
Let us assume that all members of an isolated population start on a particular diet, which is not the optimal diet for them. The exception is one single lucky individual that has a special genetic mutation, and for whom the diet is either optimal or quasi-optimal. Let us also assume that the mutation leads the individual and his or her descendants to have, on average, twice as many surviving children as other unrelated individuals. That translates into a selective advantage (s) of 100%. Finally, let us conservatively assume that the population is relatively large, with 10,000 individuals.
In this case, the mutation will spread to the entire population in approximately 396 years.
Descendants of individuals in that population (e.g., descendants of the Yanomamö) may posses the trait, even after some fair mixing with descendants of other populations, because a trait that goes into fixation has a good chance of being associated with dominant alleles. (Alleles are the different variants of the same gene.)
This Excel spreadsheet (link to a .xls file) is for those who want to play a bit with numbers, using the formulas above, and perhaps speculate about what they could have inherited from their not so distant ancestors. Download the file, and open it with Excel or a compatible spreadsheet system. The formulas are already there; change only the cells highlighted in yellow.
References:
Hartl, D.L., & Clark, A.G. (2007). Principles of population genetics.Sunderland , MA : Sinauer Associates.
Maynard Smith, J. (1998). Evolutionary genetics.New York , NY : Oxford University Press.
This post addresses the question: How long does it take for a food-related trait to evolve?
We need a bit of Genetics 101 first, discussed below. For more details see, e.g., Hartl & Clark, 2007; and one of my favorites: Maynard Smith, 1998. Full references are provided at the end of this post.
New gene-induced traits, including traits that affect nutrition, appear in populations through a deceptively simple process. A new genetic mutation appears in the population, usually in one single individual, and one of two things happens: (a) the genetic mutation disappears from the population; or (b) the genetic mutation spreads in the population. Evolution is a term that is generally used to refer to a gene-induced trait spreading in a population.
Traits can evolve via two main processes. One is genetic drift, where neutral traits evolve by chance. This process dominates in very small populations (e.g., 50 individuals). The other is selection, where fitness-enhancing traits evolve by increasing the reproductive success of the individuals that possess them. Fitness, in this context, is measured as the number of surviving offspring (or grand-offspring) of an individual.
Yes, traits can evolve by chance, and often do so in small populations.
Say a group of 20 human ancestors became isolated for some reason; e.g., traveled to an island and got stranded there. Let us assume that the group had the common sense of including at least a few women in it; ideally more than men, because women are really the reproductive bottleneck of any population.
In a new generation one individual develops a sweet tooth, which is a neutral mutation because the island has no supermarket. Or, what would be more likely, one of the 20 individuals already had that mutation prior to reaching the island. (Genetic variability is usually high among any group of unrelated individuals, so divergent neutral mutations are usually present.)
By chance alone, that new trait may spread to the whole (larger now) population in 80 generations, or around 1,600 years; assuming a new generation emerging every 20 years. That whole population then grows even further, and gets somewhat mixed up with other groups in a larger population (they find a way out of the island). The descendants of the original island population all have a sweet tooth. That leads to increased diabetes among them, compared with other groups. They find out that the problem is genetic, and wonder how evolution could have made them like that.
The panel below shows the formulas for the calculation of the amount of time it takes for a trait to evolve to fixation in a population. It is taken from a set of slides I used in a presentation (PowerPoint file here). To evolve to fixation means to spread to all individuals in the population. The results of some simulations are also shown. For example, a trait that provides a minute selective advantage of 1% in a population of 10,000 individuals will possibly evolve to fixation in 1,981 generations, or 39,614 years. Not the millions of years often mentioned in discussions about evolution.
I say “possibly” above because traits can also disappear from a population by chance, and often do so at the early stages of evolution, even if they increase the reproductive success of the individuals that possess them. For example, a new beneficial metabolic mutation appears, but its host fatally falls off a cliff by accident, contracts an unrelated disease and dies etc., before leaving any descendant.
How come the fossil record suggests that evolution usually takes millions of years? The reason is that it usually takes a long time for new fitness-enhancing traits to appear in a population. Most genetic mutations are either neutral or detrimental, in terms of reproductive success. It also takes time for the right circumstances to come into place for genetic drift to happen – e.g., massive extinctions, leaving a few surviving members. Once the right elements are in place, evolution can happen fast.
So, what is the implication for traits that affect nutrition? Or, more specifically, can a population that starts consuming a particular type of food evolve to become adapted to it in a short period of time?
The answer is yes. And that adaptation can take a very short amount of time to happen, relatively speaking.
Let us assume that all members of an isolated population start on a particular diet, which is not the optimal diet for them. The exception is one single lucky individual that has a special genetic mutation, and for whom the diet is either optimal or quasi-optimal. Let us also assume that the mutation leads the individual and his or her descendants to have, on average, twice as many surviving children as other unrelated individuals. That translates into a selective advantage (s) of 100%. Finally, let us conservatively assume that the population is relatively large, with 10,000 individuals.
In this case, the mutation will spread to the entire population in approximately 396 years.
Descendants of individuals in that population (e.g., descendants of the Yanomamö) may posses the trait, even after some fair mixing with descendants of other populations, because a trait that goes into fixation has a good chance of being associated with dominant alleles. (Alleles are the different variants of the same gene.)
This Excel spreadsheet (link to a .xls file) is for those who want to play a bit with numbers, using the formulas above, and perhaps speculate about what they could have inherited from their not so distant ancestors. Download the file, and open it with Excel or a compatible spreadsheet system. The formulas are already there; change only the cells highlighted in yellow.
References:
Hartl, D.L., & Clark, A.G. (2007). Principles of population genetics.
Maynard Smith, J. (1998). Evolutionary genetics.
Monday, August 26, 2019
How much alcohol is optimal? Maybe less than you think
I have been regularly recommending to users of the software HCE () to include a column in their health data reflecting their alcohol consumption. Why? Because I suspect that alcohol consumption is behind many of what we call the “diseases of affluence”.
A while ago I recall watching an interview with a centenarian, a very lucid woman. When asked about her “secret” to live a long life, she said that she added a little bit of whiskey to her coffee every morning. It was something like a tablespoon of whiskey, or about 15 g, which amounted to approximately 6 g of ethanol every single day.
Well, she might have been drinking very close to the optimal amount of alcohol per day for the average person, if the study reviewed in this post is correct.
Studies of the effect of alcohol consumption on health generally show results in terms of averages within fixed ranges of consumption. For example, they will show average mortality risks for people consuming 1, 2, 3 etc. drinks per day. These studies suggest that there is a J-curve relationship between alcohol consumption and health (). That is, drinking a little is better than not drinking; and drinking a lot is worse than drinking a little.
However, using “rough” ranges of 1, 2, 3 etc. drinks per day prevents those studies from getting to a more fine-grained picture of the beneficial effects of alcohol consumption.
Contrary to popular belief, the positive health effects of moderate alcohol consumption have little, if anything, to do with polyphenols such as resveratrol. Resveratrol, once believed to be the fountain of youth, is found in the skin of red grapes.
It is in fact the alcohol content that has positive effects, apparently reducing the incidence of coronary heart disease, diabetes, hypertension, congestive heart failure, stroke, dementia, Raynaud’s phenomenon, and all-cause mortality. Raynaud's phenomenon is associated with poor circulation in the extremities (e.g., toes, fingers), which in some cases can progress to gangrene.
In most studies of the effects of alcohol consumption on health, the J-curves emerge from visual inspection of the plots of averages across ranges of consumption. Rarely you find studies where nonlinear relationships are “discovered” by software tools such as WarpPLS (), with effects being adjusted accordingly.
You do find, however, some studies that fit reasonably justified functions to the data. Di Castelnuovo and colleagues’ study, published in JAMA Internal Medicine in 2006 (), is probably the most widely cited among these studies. This study is a meta-analysis; i.e., a study that builds on various other empirical studies.
I think that the journal in which this study appeared was formerly known as Archives of Internal Medicine, a fairly selective and prestigious journal, even though this did not seem to be reflected in its Wikipedia article at the time of this writing ().
What Di Castelnuovo and colleagues found is interesting. They fitted a bunch of nonlinear functions to the data, all with J-curve shapes. The results suggest a lot of variation in the maximum amount one can drink before mortality becomes higher than not drinking at all; that maximum amount ranges from about 4 to 6 drinks per day.
But there is little variation in one respect. The optimal amount of alcohol is somewhere around 5 and 7 g/d, which translates into about the following every day: half a can of beer, half a glass of wine, or half a “shot” of spirit. This is clearly a common trait of all of the nonlinear functions that they generated. This is illustrated in the figure below, from the article.
As you can seen from the curves above, a little bit of alcohol every day seems to have an acute effect on mortality reduction. And it seems that taking little doses every day is much better than taking the equivalent dose over a larger period of time; for instance, the equivalent per week, taken once a week. This is suggested by other studies as well ().
The curves above do not clearly reflect a couple of problems with alcohol consumption. One is that alcohol seems to be treated by the body as a toxin, which causes some harm and some good at the same time, the good being often ascribed to hormesis (). Someone who is more sensitive to alcohol’s harmful effects, on the liver for example, may not benefit as much from its positive effects.
The curves are averages that pass through points, after which the points are forgotten; even though they are real people.
The other problem with alcohol is that most people who are introduced to it in highly urbanized areas (where most people live) tend to drink it because of its mood-altering effects. This leads to a major danger of addiction and abuse. And drinking a lot of alcohol is much worse than not drinking at all.
Interestingly, in traditional Mediterranean Cultures where wine is consumed regularly, people tend to generally frown upon drunkenness ().
A while ago I recall watching an interview with a centenarian, a very lucid woman. When asked about her “secret” to live a long life, she said that she added a little bit of whiskey to her coffee every morning. It was something like a tablespoon of whiskey, or about 15 g, which amounted to approximately 6 g of ethanol every single day.
Well, she might have been drinking very close to the optimal amount of alcohol per day for the average person, if the study reviewed in this post is correct.
Studies of the effect of alcohol consumption on health generally show results in terms of averages within fixed ranges of consumption. For example, they will show average mortality risks for people consuming 1, 2, 3 etc. drinks per day. These studies suggest that there is a J-curve relationship between alcohol consumption and health (). That is, drinking a little is better than not drinking; and drinking a lot is worse than drinking a little.
However, using “rough” ranges of 1, 2, 3 etc. drinks per day prevents those studies from getting to a more fine-grained picture of the beneficial effects of alcohol consumption.
Contrary to popular belief, the positive health effects of moderate alcohol consumption have little, if anything, to do with polyphenols such as resveratrol. Resveratrol, once believed to be the fountain of youth, is found in the skin of red grapes.
It is in fact the alcohol content that has positive effects, apparently reducing the incidence of coronary heart disease, diabetes, hypertension, congestive heart failure, stroke, dementia, Raynaud’s phenomenon, and all-cause mortality. Raynaud's phenomenon is associated with poor circulation in the extremities (e.g., toes, fingers), which in some cases can progress to gangrene.
In most studies of the effects of alcohol consumption on health, the J-curves emerge from visual inspection of the plots of averages across ranges of consumption. Rarely you find studies where nonlinear relationships are “discovered” by software tools such as WarpPLS (), with effects being adjusted accordingly.
You do find, however, some studies that fit reasonably justified functions to the data. Di Castelnuovo and colleagues’ study, published in JAMA Internal Medicine in 2006 (), is probably the most widely cited among these studies. This study is a meta-analysis; i.e., a study that builds on various other empirical studies.
I think that the journal in which this study appeared was formerly known as Archives of Internal Medicine, a fairly selective and prestigious journal, even though this did not seem to be reflected in its Wikipedia article at the time of this writing ().
What Di Castelnuovo and colleagues found is interesting. They fitted a bunch of nonlinear functions to the data, all with J-curve shapes. The results suggest a lot of variation in the maximum amount one can drink before mortality becomes higher than not drinking at all; that maximum amount ranges from about 4 to 6 drinks per day.
But there is little variation in one respect. The optimal amount of alcohol is somewhere around 5 and 7 g/d, which translates into about the following every day: half a can of beer, half a glass of wine, or half a “shot” of spirit. This is clearly a common trait of all of the nonlinear functions that they generated. This is illustrated in the figure below, from the article.
As you can seen from the curves above, a little bit of alcohol every day seems to have an acute effect on mortality reduction. And it seems that taking little doses every day is much better than taking the equivalent dose over a larger period of time; for instance, the equivalent per week, taken once a week. This is suggested by other studies as well ().
The curves above do not clearly reflect a couple of problems with alcohol consumption. One is that alcohol seems to be treated by the body as a toxin, which causes some harm and some good at the same time, the good being often ascribed to hormesis (). Someone who is more sensitive to alcohol’s harmful effects, on the liver for example, may not benefit as much from its positive effects.
The curves are averages that pass through points, after which the points are forgotten; even though they are real people.
The other problem with alcohol is that most people who are introduced to it in highly urbanized areas (where most people live) tend to drink it because of its mood-altering effects. This leads to a major danger of addiction and abuse. And drinking a lot of alcohol is much worse than not drinking at all.
Interestingly, in traditional Mediterranean Cultures where wine is consumed regularly, people tend to generally frown upon drunkenness ().
Labels:
alcohol,
atherosclerosis,
diabetes,
heart disease,
J curve
Wednesday, July 24, 2019
Ketosis, methylglyoxal, and accelerated aging: Probably more fiction than fact
This is a follow up on this post. Just to recap, an interesting hypothesis has been around for quite some time about a possible negative effect of ketosis. This hypothesis argues that ketosis leads to the production of an organic compound called methylglyoxal, which is believed to be a powerful agent in the formation of advanced glycation endproducts (AGEs).
In vitro research, and research with animals (e.g., mice and cows), indeed suggests negative short-term effects of increased ketosis-induced methylglyoxal production. These studies typically deal with what appears to be severe ketosis, not the mild type induced in healthy people by very low carbohydrate diets.
However, the bulk of methylglyoxal is produced via glycolysis, a multi-step metabolic process that uses sugar to produce the body’s main energy currency – adenosine triphosphate (ATP). Ketosis is a state whereby ketones are used as a source of energy instead of glucose.
(Ketones also provide an energy source that is distinct from lipoprotein-bound fatty acids and albumin-bound free fat acids. Those fatty acids appear to be preferred vehicles for the use of dietary or body fat as a source of energy. Yet it seems that small amounts of ketones are almost always present in the blood, even if they do not show up in the urine.)
Thus it follows that ketosis is associated with reduced glycolysis and, consequently, reduced methylglyoxal production, since the bulk of this substance (i.e., methylglyoxal) is produced through glycolysis.
So, how can one argue that ketosis is “a recipe for accelerated AGEing”?
One guess is that ketosis is being confused with ketoacidosis, a pathological condition in which the level of circulating ketones can be as much as 40 to 80 times that found in ketosis. De Grey (2007) refers to “diabetic patients” when he talks about this possibility (i.e., the connection with accelerated AGEing), and ketoacidosis is an unfortunately common condition among those with uncontrolled diabetes.
A gentle body massage is relaxing, and thus health-promoting. Add 40 times to the pressure, and the massage will become a form of physical torture; certainly unhealthy. That does not mean that a gentle body massage is unhealthy.
Interestingly, ketoacidosis often happens together with hyperglycemia, so at least part of the damage associated with ketoacidosis is likely to be caused by high blood sugar levels. Ketosis, on the other hand, is not associated with hyperglycemia.
Finally, if ketosis led to accelerated AGEing to the same extent as, or worse than, chronic hyperglycemia does, where is the long-term evidence?
Since the late 1800s people have been experimenting with ketosis-inducing diets, and documenting the results. The Inuit and other groups have adopted ketosis-inducing diets for much longer, although evolution via selection might have played a role in these cases.
No one seems to have lived to be 150 years of age, but where are the reports of conditions akin to those caused by chronic hyperglycemia among the many that went “banting” in a more strict way since the late 1800s?
The arctic explorer Vilhjalmur Stefansson, who is reported to have lived much of his adult life in ketosis, died in 1962, in his early 80s. After reading about his life, few would disagree that he lived a rough life, with long periods without access to medical care. I doubt that Stefansson would have lived that long if he had suffered from untreated diabetes.
Severe ketosis, to the point of large amounts of ketones being present in the urine, may not be a natural state in which our Paleolithic ancestors lived most of the time. In modern humans, even a 24 h water fast, during an already low carbohydrate diet, may not induce ketosis of this type. Milder ketosis states, with slightly elevated concentrations of ketones showing up in blood tests, can be achieved much more easily.
In conclusion, the notion that ketosis causes accelerated aging to the same extent as chronic hyperglycemia seems more like fiction than fact.
Reference:
De Grey, A. (2007). Ending aging: The rejuvenation breakthroughs that could reverse human aging in our lifetime. New York: NY: St. Martin’s Press.
In vitro research, and research with animals (e.g., mice and cows), indeed suggests negative short-term effects of increased ketosis-induced methylglyoxal production. These studies typically deal with what appears to be severe ketosis, not the mild type induced in healthy people by very low carbohydrate diets.
However, the bulk of methylglyoxal is produced via glycolysis, a multi-step metabolic process that uses sugar to produce the body’s main energy currency – adenosine triphosphate (ATP). Ketosis is a state whereby ketones are used as a source of energy instead of glucose.
(Ketones also provide an energy source that is distinct from lipoprotein-bound fatty acids and albumin-bound free fat acids. Those fatty acids appear to be preferred vehicles for the use of dietary or body fat as a source of energy. Yet it seems that small amounts of ketones are almost always present in the blood, even if they do not show up in the urine.)
Thus it follows that ketosis is associated with reduced glycolysis and, consequently, reduced methylglyoxal production, since the bulk of this substance (i.e., methylglyoxal) is produced through glycolysis.
So, how can one argue that ketosis is “a recipe for accelerated AGEing”?
One guess is that ketosis is being confused with ketoacidosis, a pathological condition in which the level of circulating ketones can be as much as 40 to 80 times that found in ketosis. De Grey (2007) refers to “diabetic patients” when he talks about this possibility (i.e., the connection with accelerated AGEing), and ketoacidosis is an unfortunately common condition among those with uncontrolled diabetes.
A gentle body massage is relaxing, and thus health-promoting. Add 40 times to the pressure, and the massage will become a form of physical torture; certainly unhealthy. That does not mean that a gentle body massage is unhealthy.
Interestingly, ketoacidosis often happens together with hyperglycemia, so at least part of the damage associated with ketoacidosis is likely to be caused by high blood sugar levels. Ketosis, on the other hand, is not associated with hyperglycemia.
Finally, if ketosis led to accelerated AGEing to the same extent as, or worse than, chronic hyperglycemia does, where is the long-term evidence?
Since the late 1800s people have been experimenting with ketosis-inducing diets, and documenting the results. The Inuit and other groups have adopted ketosis-inducing diets for much longer, although evolution via selection might have played a role in these cases.
No one seems to have lived to be 150 years of age, but where are the reports of conditions akin to those caused by chronic hyperglycemia among the many that went “banting” in a more strict way since the late 1800s?
The arctic explorer Vilhjalmur Stefansson, who is reported to have lived much of his adult life in ketosis, died in 1962, in his early 80s. After reading about his life, few would disagree that he lived a rough life, with long periods without access to medical care. I doubt that Stefansson would have lived that long if he had suffered from untreated diabetes.
Severe ketosis, to the point of large amounts of ketones being present in the urine, may not be a natural state in which our Paleolithic ancestors lived most of the time. In modern humans, even a 24 h water fast, during an already low carbohydrate diet, may not induce ketosis of this type. Milder ketosis states, with slightly elevated concentrations of ketones showing up in blood tests, can be achieved much more easily.
In conclusion, the notion that ketosis causes accelerated aging to the same extent as chronic hyperglycemia seems more like fiction than fact.
Reference:
De Grey, A. (2007). Ending aging: The rejuvenation breakthroughs that could reverse human aging in our lifetime. New York: NY: St. Martin’s Press.
Labels:
AGEs,
Atkins,
diabetes,
ketosis,
methylglyoxal,
research,
Vilhjalmur Stefansson
Subscribe to:
Posts (Atom)