
A forgotten warning: Causation without correlation
Often those who conduct multivariate statistical analyses on data are unaware of certain limitations. Many times this is due to lack of familiarity with statistical tests. One warning we do see a lot though is: Correlation does not imply causation. This is, of course, absolutely true. If you take my weight from 1 to 20 years of age, and the price of gasoline in the US during that period, you will find that they are highly correlated. But common sense tells me that there is no causation whatsoever between these two variables.
So correlation does not imply causation alright, but there is another warning that is rarely seen: There can be strong causation without any correlation. Of course this can lead to even more bizarre conclusions than the “correlation does not imply causation” problem. If there is strong causation between variables B and Y, and it is not showing as a correlation, another variable A may “jump in” and “steal” that “unused correlation”; so to speak.
The chain smokers “study”
To illustrate this point, let us consider the following fictitious case, a study of “100 cities”. The study focuses on the effect of smoking and genes on lung cancer mortality. Smoking significantly increases the chances of dying from lung cancer; it is a very strong causative factor. Here are a few more details. Between 35 and 40 percent of the population are chain smokers. And there is a genotype (a set of genes), found in a small percentage of the population (around 7 percent), which is protective against lung cancer. All of those who are chain smokers die from lung cancer unless they die from other causes (e.g., accidents). Dying from other causes is a lot more common among those who have the protective genotype.
(I created this fictitious data with these associations in mind, using equations. I also added uncorrelated error into the equations, to make the data look a bit more realistic. For example, random deaths occurring early in life would reduce slightly any numeric association between chain smoking and cancer deaths in the sample of 100 cities.)
The table below shows part of the data, and gives an idea of the distribution of percentage of smokers (Smokers), percentage with the protective genotype (Pgenotype), and percentage of lung cancer deaths (MLCancer). (Click on it to enlarge. Use the "CRTL" and "+" keys to zoom in, and CRTL" and "-" to zoom out.) Each row corresponds to a city. The rest of the data, up to row 100, has a similar distribution.

The graphs below show the distribution of lung cancer deaths against: (a) the percentage of smokers, at the top; and (b) the percentage with the protective genotype, at the bottom. Correlations are shown at the top of each graph. (They can vary from -1 to 1. The closer they are to -1 or 1, the stronger is the association, negative or positive, between the variables.) The correlation between lung cancer deaths and percentage of smokers is slightly negative and statistically insignificant (-0.087). The correlation between lung cancer deaths and percentage with the protective genotype is negative, strong, and statistically significant (-0.613).
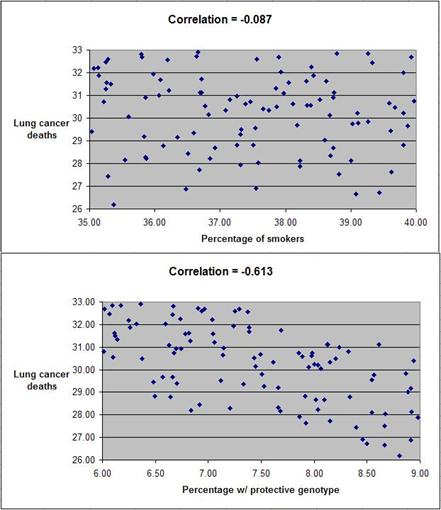
Even though smoking significantly increases the chances of dying from lung cancer, the correlations tell us otherwise. The correlations tell us that lung cancer does not seem to cause lung cancer deaths, and that having the protective genotype seems to significantly decrease cancer deaths. Why?
If there is no variation, there is no correlation
The reason is that the “researchers” collected data only about chain smokers. That is, the variable “Smokers” includes only chain smokers. If this was not a fictitious case, focusing the study on chain smokers could be seen as a clever strategy employed by researchers funded by tobacco companies. The researchers could say something like this: “We focused our analysis on those most likely to develop lung cancer.” Or, this could have been the result of plain stupidity when designing the research project.
By restricting their study to chain smokers the researchers dramatically reduced the variability in one particular variable: the extent to which the study participants smoked. Without variation, there can be no correlation. No matter what statistical test or software is used, no significant association will be found between lung cancer deaths and percentage of smokers based on this dataset. No matter what statistical test or software is used, a significant and strong association will be found between lung cancer deaths and percentage with the protective genotype.
Of course, this could lead to a very misleading conclusion. Smoking does not cause lung cancer; the real cause is genetic.
A note about diet
Consider the analogy between smoking and consumption of a particular food, and you will probably see what this means for the analysis of observational data regarding dietary choices and disease. This applies to almost any observational study, including the China Study. (Studies employing experimental control manipulations would presumably ensure enough variation in the variables studied.) In the China Study, data from dozens of counties were collected. One may find a significant association between consumption of food A and disease Y.
There may be a much stronger association between food B and disease Y, but that association may not show up in statistical analyses at all, simply because there is little variation in the data regarding consumption of food B. For example, all those sampled may have eaten food B; about the same amount. Or none. Or somewhere in between, within a rather small range of variation.
Statistical illiteracy, bad choices, and taxation
Statistics is a “necessary evil”. It is useful to go from small samples to large ones when we study any possible causal association. By doing so, one can find out whether an observed effect really applies to a larger percentage of the population, or is actually restricted to a small group of individuals. The problem is that we humans are very bad at inferring actual associations from simply looking at large tables with numbers. We need statistical tests for that.
However, ignorance about basic statistical phenomena, such as the one described here, can be costly. A group of people may eliminate food A from their diet based on coefficients of association resulting from what seem to be very clever analyses, replacing it with food B. The problem is that food B may be equally harmful, or even more harmful. And, that effect may not show up on statistical analyses unless they have enough variation in the consumption of food B.
Readers of this blog may wonder why we explicitly use terms like “suggests” when we refer to a relationship that is suggested by a significant coefficient of association (e.g., a linear correlation). This is why, among other reasons.
One does not have to be a mathematician to understand basic statistical concepts. And doing so can be very helpful in one’s life in general, not only in diet and lifestyle decisions. Even in simple choices, such as what to be on. We are always betting on something. For example, any investment is essentially a bet. Some outcomes are much more probable than others.
Once I had an interesting conversation with a high-level officer of a state government. I was part of a consulting team working on an information technology project. We were talking about the state lottery, which was a big source of revenue for the state, comparing it with state taxes. He told me something to this effect:
Our lottery is essentially a tax on the statistically illiterate.

40 comments:
Good post--it's funny how, since most people never personally analyze or understand statistical methods, you can convince them of anything...
..."Saturated fat is unhealthy" is an obvious example.
I just learned more about statistics than I did in my one very confusing class in college.
This would be a good place to insert the famous quote popularized by Mark Twain:
"Figures often beguile me, particularly when I have the arranging of them myself; in which case the remark attributed to Disraeli would often apply with justice and force: 'There are three kinds of lies: lies, damned lies, and statistics.'"
Scott W
Great explanation!
Should be required reading! I recall Stephan over at Whole Health Source arguing several times that observational studies on O6 fats are mostly worthless because almost everyone consumes huge excesses of the stuff and there is not enough variation.
There are other statistical "illusions" that are a bit different, but that also are due to analysis of too narrow a range of data.
Take, for example, the antiquated conclusions related to saturated fat -> total cholesterol -> heart disease, mentioned by john.
I think that they are mostly due to the U curve shape of the relationship between TC and HD:
http://healthcorrelator.blogspot.com/2009/12/total-cholesterol-and-cardiovascular.html
SF intake tends to increase TC. The left side of the U curve is TC lowering HD (as in one of the last China Study posts). The right side is TC going up with HD because TC is also a marker of HD.
If researchers look only at data that falls on the right side of the U curve, they may easily conclude that TC causes HD.
Hi Brandon.
I wonder whether some of the effects blamed on the O6/O3 ratio are not really due to O3 deficiency.
This reminds me of the sodium/potassium ratio. Again, studies seem to often mistake this ratio with potassium deficiency as a cause of health problems:
http://healthcorrelator.blogspot.com/2010/01/low-modern-potassium-to-sodium-ratio.html
A couple of posts, one mine (my last on the China Study) and one from Stephan, that are related to this post:
http://wholehealthsource.blogspot.com/2008/07/wheat-is-invading-china.html
http://healthcorrelator.blogspot.com/2010/09/china-study-ii-wheat-flour-rice-and.html
It is interesting how ideas converge. I hadn't read Stephan's post before I wrote this one.
Awesome post, thanks! Great blog.
Very nice teaching demo, Ned. This type of lesson really must be taught to every high-school and college student. It might ward off a lot of gullibility.
On a pedantic note, I've noticed you use the term "statistically insignificant" in this and prior posts when you mean to say "statistically nonsignificant". They have very different meanings, such as a nonsignificant correlation may well have a very significant meaning or interpretation to us.
funny you mention about the O3.... i have always thought that too. i think it may be a lack of O3 and not so much as o6 is bad when it is from natural 'paleo' sources. i just cant see not eating a walnut b/c it has a lot of o6
Ned,
Your wording is a bit confusing in the comment on polyunsaturated fats and sodium/potassium. Do you think that people have a K/n-3 deficiency or that they over consume Na/n-6?
Hi john.
What I meant to say is that some of the effects blamed on a high O6/O3 ratio may actually be due to O3 deficiency. Both O6 and O3 are essential fats, which must be part of one's diet.
That is not to say that the O6/O3 ratio is irrelevant. Still, many studies that focus on the effect of the ratio on certain diseases (usually a high O6/O3 ratio is the problem) fail to also account for the effect of the amount of O3 in the diet.
Even a O6/O3 ratio of 1 will be unhealthy if the actual amount of O3 is below a certain threshold. The same applies to O6.
Hi Mal.
That's a good point. As with many macro- and micro-nutrients, the form in which O6 and O3 fats are ingested should matter.
Industrial oils have way too much O6. On top of that, the O6 is delivered in a form that is very unnatural.
This form of delivery point reminds me of fructose. Even Lustig agrees that fructose ingested by eating fruits is pretty much harmless. Take it in isolated/refined form, on the other hand, and you are sure to have problems.
Hi Aaron.
Good point regarding "insignificant" vs. "non-significant". I generally dislike "non-" terms, and try to avoid them - sometimes at the expense of precision.
thanks for the reply and again, have been curious about fruit too b/c it seems whatever all the fruit comes with makes the fuctose in it manageable
May I give my interpretation of the O6/O3 level thing. It's not backed directly by literature but, is the fruit of the functional understanding by reading all the good blogs of which yours is part.
I think that the main error made when considering O6/O3 ratios is not to distinguish between the C18 fatty acids (linoleic and linolenic acid) and the longer chain ones (ARA and EPA/DHA). The ration is important if you have no other source of the longer chain omega3s, because you have to convert them yourself. If you have an overwhelming O6 ingestion in the form of seed oils, you will have a surplus of ARA but a deficit in EPA/DHA. Ingesting more ARA contained in meats and eggs will obviously not correct anything, but taking supplementation or eating a EPA/DHA rich diet (fish oil, cod liver oil, brain, sea food etc) will at least alleviate the omega3 deficiency. This won't, of course, correct the other bad effects of polyinsaturates like oxydative stress and the effect on the liver (if I remember correctly one of the effects of polys (O3 and O6) on the liver was to block the release of triglycerides during lipogenesis, so high carb+polyoils=fatty liver)
We should not forget that LA and LNA are not essential per se, they are only used as building block to the real essential fatty acids.
As already said, that's my interpretation of what I read here and there, there's the possibility that I'm really off here.
So in short, my message is, more important than the ratio of O6/O3 is the nature of the fatty acids ingested.
It gets more interesting than that if you start questioning classical statistics and use Bayesian paradigm instead. But it is also dangerous, as when you give up the convenience of p-values, a good half of the published evidence based on "statistical signifficance" might become rubbish. Which is why I often prefer to see the larger picture and trust intuition more than clinical trials. For my private purposed only, that is; officially p-value is king.
Excellent reading from Steven Goodman:
http://psg-mac43.ucsf.edu/ticr/syllabus/courses/4/2003/11/13/Lecture/readings/Steven%20Goodman.pdf
and
http://psg-mac43.ucsf.edu/ticr/syllabus/courses/4/2003/11/13/Lecture/readings/Steven%20Goodman%202.pdf
Another trap is to think that the magic of randomization is always better than a good obesrvational study...
Hi gallier2, thanks. Very good points.
Let me just comment on the liver-related effect you mentioned. It seems that blocking the release of trigs is a good thing, but up to a point (the ubiquitous U-curve pattern again). After all, this seems to be what niacin does, in 1-3 g doses. More than that and you have liver problems (U curve again).
This is pure speculation on my part, but I believe that the mechanism is as follows:
- Trigs release inhibition makes the liver delay its production of VLDL particles.
- In turn, there is an increase in serum free fatty acids (FFAs), which feed the tissues that can use them for energy (e.g., muscle tissues).
- When VLDL particles are secreted, they are large, with a lot of fat in them.
- Those large VLDL particles deliver their fat cargo to various tissues (e.g., muscle).
- Since FFAs already provided part of the energy that VLDL particles would, those particles don't decrease in size as much, ending their life as large-buoyant LDL particles.
Large-buoyant LDL particles are non-atherogenic. So, the PUFAs from nuts and other sources are likely to have an overall positive effect on health, as long as their consumption is not so high as to cross a certain threshold. That threshold is the one above which the blocking of trigs release turns the liver into a fat storage organ. That is fatty liver territory.
This post has some photos of VLDL particles:
http://healthcorrelator.blogspot.com/2010/02/large-ldl-and-small-hdl-particles-best.html
Hi PaleoDoc.
First of all, good to see you blogging again. Your posts and comments are always very interesting and thought-provoking.
My approach is very similar to yours. In fact, I really like seeing qualitative data analyses (as in in-depth case studies, or action research) combined with quantitative analyses.
Indeed, it is not a good idea to ignore observational studies. If John walks under an unprotected construction site and a brick falls on his head, it is not very wise to wait for a controlled study before he starts avoiding walking near unprotected construction sites.
In fact, I don't think it is a good idea to ignore even badly designed research, or research that departs from wrong assumptions, because often that research tells us some things that we would not be told otherwise. This one on the short-term effects of fat on adiponectin and TNF, for example, ends up telling us something about the negative short-term effects of refined carbs on those hormones (and the possible protective effects of saturate fat):
http://healthcorrelator.blogspot.com/2010/03/adiponectin-and-tumor-necrosis-factor.html
What we need is more research, from different angles and using various methods, on the health effects of Neolithic foods in general.
Thank you Ned! I really needed this post.
PaleoDoc and Ned,
I agree that data quantification can often be overly restrictive. I always have my students visually graph their data first before running any standard or even non-standard statistics. If I see a pattern staring me in the face, then I know that there is a meaningful independent-dependent variable relationship there. Often, conventional quantifications of that relationship don't pass a test of significance. My students get disappointed at this step. I tell them to look at their graphical data and try to think why the conventional approach may not have worked and to think creatively about how a solution may be found.
As an analogy, if you were at a concert you know it took place. If you tried to record the concert but had an inadequate microphone, then someone listening to your recording may not believe the concert took place. Or perhaps you were too close or distant from the speakers and so the people standing around you talking and yelling obscured the signal from the speakers. Quantitative statistics are a lot like the crude method of using a microphone to record a concert in a noisy setting. Sometimes you must question the tool at hand and try a different one better suited to each particular situation. It's more work (and you have to actually think about your data), but it's well worth the extra effort. And, hell, it should be fun for these students, shouldn't it?
Hi Aaron.
I agree, and I also think that stats software tools should generally do a better job at graphing. Seeing how numeric data is distributed, from different angles (i.e., using different types of graphs), is very useful.
Eysenck claimed that very few studies acually followed those who gave up smoking to see if they lived longer than a matched set of smokers. He mantained an Australian study that did showed the stress of giving up smoking shortened life.
And of course the oldest human of all time smoked till shree was 117, but no more than a day.
And of course the oldest human of all time smoked till she was 117, but no more than 2 a day
Thanks Ed for the post and Aaron too for the insights.
Hi Ken.
Smoking seems to have been common among many hunter-gatherer cultures. However, one thing that I noticed from viewing tapes about hunter-gatherers smoking is that they often don't inhale the smoke.
Still, they seem to have more of certain types of cancer that are associated with smoking (even if not inhaling), such as nasopharynx, salivary gland, and oesophageal.
See the mildly Westernized Inuit on the post below, for example:
http://healthcorrelator.blogspot.com/2010/01/cancer-patterns-in-inuit-populations.html
Hmm... http://www.businessweek.com/lifestyle/content/healthday/643291.html
Hmm... http://tinyurl.com/2dxzu8n
Study Claims Flu Shots Associated With Lower Risk of Heart Attack
Hi js290.
Interesting. Many "diseases of civilization" are associated with infections. For example, it is not uncommon to see people being diagnosed with T1D after an infection.
The protective effect of vaccination is consistent with the idea that our unnatural lack of exposure to pathogens while growing up impairs our ability to fight disease later on. Vaccines arguably make up for that, to a certain extent.
On the other hand, certain types of vaccines seem to be associated with disease. Sorry, I don't have a reference now.
Vaccination is a controversial topic.
Thank you ever so much for expanding my knowledge. This will be used to rub a few faces in.
Our lottery is essentially a tax on the statistically illiterate.
A woman was dubbed the 'luckiest in the world' for winning multi-million lotteries four times, but was later found to be a university professor and statistics PhD who cracked the system but has still not shared her secret.
http://www.facebook.com/permalink.php?story_fbid=367127890024177&id=274413899295577
-
But she won by scratch off not numbers
"Scratch lotto tickets are vulnerable to statistical analysis."
http://www.theatlantic.com/personal/archive/2011/02/how-i-beat-scratch-off-lottery-tickets/70686/
This lack of variation is especially crucial for carbohydrate-fat ratios which do not vary so much in society as to tell the readers of this blog anything much.
Hi, nice example of "wrong statistics". I agree, that a lack of correlation can indeed lead to the false impression 'no causation'. I disagree, however, with the reason you provide here, that in this virtual study the lack of correlation has to do with reduced variability (dichotomization of the population into chainsmokers and others).
The actual reason is that causes of between group differences are not (necessarily) the same as causes of within group differences. In your study a 'between groups (states) association' is calculated, while the supposed 'cause' refers to 'within group (state) differences', namely differences between smokers and nonsmokers. There is no reason to belief that moving to a state in which relatively many smokers live, would increase your risk of dying from lung cancer, for example. Risks from dying from lung cancer are not necessarily the same across states.
To claim that smoking increases the risk of dying from lung cancer one would need an experimental design after which statistical testing is required. Manipulation of smoking behavior should result in changes in the prevalence of lung cancer and the average change should deviate enough from zero to be considered significant. Because in the present study such experimental design is not possible/warranted, for obvious ethical reasons, one would depend on correlative designs. True causality cannot be proven, but one can speak of increased risk. In order to claim increased risk of dying from lungcancer as ‘being the results of’ smoking one needs to show that (within states) there is a significant association between smoking behavior and dying from lungcancer (you can express this association as a correlation). Next, one has to make plausible the relation ‘differences in smoking’ -> ‘differences in risk of dying from lung cancer’, e.g., by stating that the opposite direction (‘differences in dying from lung cancer’ -> differences in smoking’) is implausible.
Because the design is not experimental, the question would still be whether smoking is truly or directly an increased risk factor, however. After all the same genes can be predictive of both smoking behavior and of lung cancer, for instance. In the group of people who are genetically at risk at developing lung cancer (no matter whether they smoke or not) the frequency of smoking may be higher than in the group of people who are genetically not at risk. If smoking is not a cause of dying from cancer, while genes are influencing both, you would then still find an association between smoking and dying from lung cancer. You would need a multivariate model to account for the genetic differences.
In your post I missed evidence that smoking (causally) increases the risk of dying from lung cancer. To do so you needed to provide the frequencies (again: within states) of dying from lung cancer in both groups (chain smokers and nonchainsmokers), rather than providing the frequencies of chain smoking and lung cancer deaths. You could show that the prevalence of dying from lung cancer is systematically and significantly higher in chain smokers than in the other group. (There is no problem with a distinction between chainsmokers and non-chainsmokers (one just tests whether in a particular population (state) CHAIN smokers have [compared to others] an increased chance of dying from lung cancer. )
One could use meta-analysis (for example) to calculate a weighted average association strength (and to investigate sources of heterogeneity in association strengths). A multi-level approach is another option. If it would turn out that (on average) there is no association, then causation is hard to maintain, unless you can show moderating effects are present, so that you can speak of conditional causation.
Strong causation without any correlation is almost impossible. And whenever you know a causal effect must be present, but you find a zero association, chances are high your statistical model is incorrect. (e.g. when one aims to express a relation using linear correlation coefficients to describe an effect that is quadratic, or when one uses univariate statistics while multivariate modeling is needed).
I believe causation without association is limited to systems in which cause and effect have disproportional relationships, like in chaotic systems. But even then: If you would know the actual data generating mechanism and model it, an association between outcome measure and manipulation is expected.
For a cause to be cause it requires that manipulation (which denotes systematic variation in conditions) results in changes (hence variation) in outcome measures. If manipulation leads to actual unsystematic effects we wouldn't be able to find a relationship. Then the last question arises: Do we then still speak of causation? I can come up with scientific philosophical arguments to say no (but also to say yes). The concept of causation is all but unambiguous.
Post a Comment