
As I said before on this blog, I am yet to be convinced that grilled meat is truly unhealthy in the absence of leaky gut problems. I am referring here to high heat cooking-induced Maillard reactions (browning) and the resulting advanced glycation endproducts (AGEs). Whenever you cook a food in high heat, to the point of browning it, you generate a Maillard reaction. Searing and roasting meat usually leads to that.
Elevated levels of serum AGEs presumably accelerate the aging process in humans. This is supported by research with uncontrolled diabetics, who seem to have elevated levels of serum AGEs. In fact, a widely used measure in the treatment of diabetes, the HbA1c (or percentage of glycated hemoglobin), is actually a measure of endogenous AGE formation. (Endogenous = generated by our own bodies.)
Still, evidence that a person with an uncompromised gut can cause serum levels of AGEs to go up significantly by eating AGEs is weak, and evidence that any related serum AGE increases lead the average person to develop health problems is pretty much nonexistent. The human body can handle AGEs, as long as their concentration is not too high. We cannot forget that a healthy HbA1c in humans is about 5 percent; meaning that AGEs are created and dealt with by our bodies. A healthy HbA1c in humans is not 0 percent.
Thanks again to Justin for sending me the full text version of the Birlouez-Aragon et al. (2010) article, which is partially reviewed here. See this post and the comments under it for some background on this discussion. The article is unequivocally titled: “A diet based on high-heat-treated foods promotes risk factors for diabetes mellitus and cardiovascular diseases.”
This article is recent, and has already been cited by news agencies and bloggers as providing “definitive” evidence that high-heat cooking is bad for one’s health. Interestingly, quite a few of those citations are in connection with high-heat cooking of meat, which is not even the focus of the article.
In fact, the Birlouez-Aragon et al. (2010) article provides no evidence that high-heat cooking of meat leads to AGEing in humans. If anything, the article points at the use of industrial vegetable oils for cooking as the main problem. And we know already that industrial vegetable oils are not healthy, whether you cook with them or drink them cold by the tablespoon.
But there are a number of good things about this article. For example, the authors summarize past research on AGEs. They focus on MRPs, which are “Maillard reaction products”. One of the summary statements supports what I have said on this blog before:
"The few human intervention trials […] that reported on health effects of dietary MRPs have all focused on patients with diabetes or renal failure."
That is, there is no evidence from human studies that dietary AGEs cause health problems outside the context of preexisting conditions that themselves seem to be associated with endogenous AGE production. To that I would add that gut permeability may also be a problem, as in celiacs ingesting large amounts of AGEs.
As you can see from the quote below, the authors decided to focus their investigation on a particular type of AGE, namely CML or carboxymethyllysine.
"...we decided to specifically quantify CML, as a well-accepted MRP indicator ..."
As I noted in my comments under this post (the oven roasted pork tenderloin post), one particular type of diet seems to lead to high serum CML levels – a vegetarian diet.
So let us see what the authors studied:
"... we conducted a randomized, crossover, intervention trial to clarify whether a habitual diet containing high-heat-treated foods, such as deep-fried potatoes, cookies, brown crusted bread, or fried meat, could promote risk factors of type 2 diabetes or cardiovascular diseases in healthy people."
Well, “deep-fried potatoes” is a red flag, don’t you think? They don’t say what oil was used for deep-frying, but I bet it was not coconut or olive oil. Cheap industrial vegetable oils (corn, safflower etc.) are the ones normally used (and re-used) for deep-frying. This is in part because these oils are cheap, and in part because they have high “smoke points” (the temperature at which the oil begins to generate smoke).
Let us see what else the authors say about the dietary conditions they compared:
"The STD was prepared by using conventional techniques such as grilling, frying, and roasting and contained industrial food known to be highly cooked, such as extruded corn flakes, coffee, dry cookies, and well-baked bread with brown crust. In contrast, the STMD comprised some raw food and foods that were cooked with steam techniques only. In addition, convenience products were chosen according to the minimal process applied (ie, steamed corn flakes, tea, sponge cakes, and mildly baked bread) ..."
The STD diet was the one with high-heat preparation of foods; in the STMD diet the foods were all steam-cooked at relatively low temperatures. Clearly these diets were mostly of plant-based foods, and of the unhealthy kind!
The following quote, from the results, pretty much tells us that the high omega-6 content of industrial oils used for deep frying was likely to be a major confounder, if not the main culprit:
"... substantial differences in the plasma fatty acid profile with higher plasma concentrations of long-chain omega-3 fatty acids […] and lower concentrations of omega-6 fatty acids […] were analyzed in the STMD group compared with in the STD group."
That is, the high-heat cooking group had higher plasma concentrations of omega-6 fats, which is what you would expect from a group consuming a large amount of industrial vegetable oils. One single tablespoon per day is already a large amount; these folks were probably consuming more than that.
Perhaps a better title for this study would have been: “A diet based on foods deep-fried in industrial vegetable oils promotes risk factors for diabetes mellitus and cardiovascular diseases.”
This study doesn’t even get close to indicting charred meat as a major source of serum AGEs. But it is not an exception among studies that many claim to do so.
Reference
H Birlouez-Aragon, I., Saavedra, G., Tessier, F.J., Galinier, A., Ait-Ameur, L., Lacoste, F., Niamba, C.-N., Alt, N., Somoza, V., & Lecerf, J.-M. (2010). A diet based on high-heat-treated foods promotes risk factors for diabetes mellitus and cardiovascular diseases. The American Journal of Clinical Nutrition, 91(5), 1220-1226.
Monday, November 8, 2010


Tuesday, October 19, 2010
Slow-cooked meat: Round steak, not grilled, but slow-cooked in a frying pan
I am yet to be convinced that grilled meat is truly unhealthy in the absence of leaky gut problems. I am referring here to high heat cooking-induced Maillard reactions and the resulting advanced glycation endproducts (AGEs). If you are interested, see this post and the comments under it, where I looked into some references provided by an anonymous commenter. In short, I am more concerned about endogenous (i.e., inside the body) formation of AGEs than with exogenous (e.g., dietary) intake.
Still, the other day I had to improvise when cooking meat, and used a cooking method that is considered by many to be fairly healthy – slow-cooking at a low temperature. I seasoned a few pieces of beef tenderloin (filet mignon) for the grill, but it started raining, so I decided to slow-cook them in a frying pan with water and some olive oil. After about 1 hour of slow-cooking, and somewhat to my surprise, they tasted more delicious than grilled!
I have since been using this method more and more, with all types of cuts of meat. It is great for round steak and top sirloin, for example, as well as cuts that come with bone. The pieces of meat come off the bone very easily, are soft, and taste great. So does much of the marrow. You also end up with a delicious sauce. Almost any cut of beef end up very soft when slow-cooked, even cuts that would normally come out from a grill a bit hard. Below is a simple recipe, for round steak (a.k.a. eye round).
- Prepare some dry seasoning powder by mixing sea salt, black pepper, dried garlic bits, chili powder, and a small amount of cayenne pepper.
- Season the round steak pieces at least 2 hours prior to placing them in the pan.
- Add a bit of water and olive oil to one or more frying pans. Two frying pans may be needed, depending on their size and the amount of meat.
- Place the round steak pieces in the frying pan, and add more water, almost to the point of covering them.
- Cook on low fire covered for 2-3 hours.
Since you will be cooking with low fire, the water will probably not evaporate completely even after 3 h. Nevertheless it is a good idea to check it every 15-30 min to make sure that this is the case, because in dry weather the water may evaporate rather fast. The water around the cuts should slowly turn into a fatty and delicious sauce, which you can pour on the meat when serving, to add flavor. The photos below show seasoned round steak pieces in a frying pan before cooking, and some cooked pieces served with sweet potatoes, orange pieces and a nectarine.


A 100 g portion will have about 34 g of protein. (A 100 g portion is a bit less than 4 oz, cooked.) The amount of fat will depend on how trimmed the cuts are. Like most beef cuts, the fat will be primarily saturated and monounsatured (both very healthy), with approximately equal amounts of each. It will provide good amounts of the following vitamins and minerals: iron, niacin, phosphorus, potassium, zinc, selenium, vitamin B6, and vitamin B12.
Still, the other day I had to improvise when cooking meat, and used a cooking method that is considered by many to be fairly healthy – slow-cooking at a low temperature. I seasoned a few pieces of beef tenderloin (filet mignon) for the grill, but it started raining, so I decided to slow-cook them in a frying pan with water and some olive oil. After about 1 hour of slow-cooking, and somewhat to my surprise, they tasted more delicious than grilled!
I have since been using this method more and more, with all types of cuts of meat. It is great for round steak and top sirloin, for example, as well as cuts that come with bone. The pieces of meat come off the bone very easily, are soft, and taste great. So does much of the marrow. You also end up with a delicious sauce. Almost any cut of beef end up very soft when slow-cooked, even cuts that would normally come out from a grill a bit hard. Below is a simple recipe, for round steak (a.k.a. eye round).
- Prepare some dry seasoning powder by mixing sea salt, black pepper, dried garlic bits, chili powder, and a small amount of cayenne pepper.
- Season the round steak pieces at least 2 hours prior to placing them in the pan.
- Add a bit of water and olive oil to one or more frying pans. Two frying pans may be needed, depending on their size and the amount of meat.
- Place the round steak pieces in the frying pan, and add more water, almost to the point of covering them.
- Cook on low fire covered for 2-3 hours.
Since you will be cooking with low fire, the water will probably not evaporate completely even after 3 h. Nevertheless it is a good idea to check it every 15-30 min to make sure that this is the case, because in dry weather the water may evaporate rather fast. The water around the cuts should slowly turn into a fatty and delicious sauce, which you can pour on the meat when serving, to add flavor. The photos below show seasoned round steak pieces in a frying pan before cooking, and some cooked pieces served with sweet potatoes, orange pieces and a nectarine.


A 100 g portion will have about 34 g of protein. (A 100 g portion is a bit less than 4 oz, cooked.) The amount of fat will depend on how trimmed the cuts are. Like most beef cuts, the fat will be primarily saturated and monounsatured (both very healthy), with approximately equal amounts of each. It will provide good amounts of the following vitamins and minerals: iron, niacin, phosphorus, potassium, zinc, selenium, vitamin B6, and vitamin B12.
Monday, October 11, 2010
Blood glucose levels in birds are high yet HbA1c levels are low: Can vitamin C have anything to do with this?
Blood glucose levels in birds are often 2-4 times higher than those in mammals of comparable size. Yet birds often live 3 times longer than mammals of comparable size. This is paradoxical. High glucose levels are generally associated with accelerated senescence, but birds seem to age much slower than mammals. Several explanations have been proposed for this, one of which is related to the formation of advanced glycation endproducts (AGEs).
Glycation is a process whereby sugar molecules “stick” to protein or fat molecules, impairing their function. Glycation leads to the formation of AGEs, which seem to be associated with a host of diseases, including diabetes, and to be implicated in accelerated aging (or “ageing”, with British spelling).
The graphs below, from Beuchat & Chong (1998), show the glucose levels (at rest and prior to feeding) and HbA1c levels (percentage of glycated hemoglobin) in birds and mammals. HbA1c is a measure of the degree of glycation of hemoglobin, a protein found in red blood cells. As such HbA1c (given in percentages) is a good indicator of the rate of AGE formation within an animal’s body.

The glucose levels are measured in mmol/l; they should be multiplied by 18 to obtain the respective measures in mg/dl. For example, the 18 mmol/l glucose level for the Anna’s (a hummingbird species) is equivalent to 324 mg/dl. Even at that high level, well above the level of a diabetic human, the Anna’s hummingbird species has an HbA1c of less than 5, which is lower than that for most insulin sensitive humans.
How can that be?
There are a few possible reasons. Birds seem to have evolved better mechanisms to control cell permeability to glucose, allowing glucose to enter cells very selectively. Birds also seem to have a higher turnover of cells where glycation and thus AGE formation results. The lifespan of red blood cells in birds, for example, is only 50 to 70 percent that of mammals.
But one of the most interesting mechanisms is vitamin C synthesis. Not only is vitamin C a powerful antioxidant, but it also has the ability to reversibly bind to proteins at the sites where glycation would occur. That is, vitamin C has the potential to significantly reduce glycation. The vast majority of birds and mammals can synthesize vitamin C. Humans are an exception. They have to get it from their diet.
This may be one of the many reasons why isolated human groups with traditional diets high in fruits and starchy tubers, which lead to temporary blood glucose elevations, tend to have good health. Fruits and starchy tubers in general are good sources of vitamin C.
Grains and seeds are not.
References
Beuchat, C.A., & Chong, C.R. (1998). Hyperglycemia in hummingbirds and its consequences for hemoglobin glycation. Comparative Biochemistry and Physiology Part A, 120(3), 409–416.
Holmes D.J., Flückiger, R., & Austad, S.N. (2001). Comparative biology of aging in birds: An update. Experimental Gerontology, 36(4), 869-883.
Glycation is a process whereby sugar molecules “stick” to protein or fat molecules, impairing their function. Glycation leads to the formation of AGEs, which seem to be associated with a host of diseases, including diabetes, and to be implicated in accelerated aging (or “ageing”, with British spelling).
The graphs below, from Beuchat & Chong (1998), show the glucose levels (at rest and prior to feeding) and HbA1c levels (percentage of glycated hemoglobin) in birds and mammals. HbA1c is a measure of the degree of glycation of hemoglobin, a protein found in red blood cells. As such HbA1c (given in percentages) is a good indicator of the rate of AGE formation within an animal’s body.

The glucose levels are measured in mmol/l; they should be multiplied by 18 to obtain the respective measures in mg/dl. For example, the 18 mmol/l glucose level for the Anna’s (a hummingbird species) is equivalent to 324 mg/dl. Even at that high level, well above the level of a diabetic human, the Anna’s hummingbird species has an HbA1c of less than 5, which is lower than that for most insulin sensitive humans.
How can that be?
There are a few possible reasons. Birds seem to have evolved better mechanisms to control cell permeability to glucose, allowing glucose to enter cells very selectively. Birds also seem to have a higher turnover of cells where glycation and thus AGE formation results. The lifespan of red blood cells in birds, for example, is only 50 to 70 percent that of mammals.
But one of the most interesting mechanisms is vitamin C synthesis. Not only is vitamin C a powerful antioxidant, but it also has the ability to reversibly bind to proteins at the sites where glycation would occur. That is, vitamin C has the potential to significantly reduce glycation. The vast majority of birds and mammals can synthesize vitamin C. Humans are an exception. They have to get it from their diet.
This may be one of the many reasons why isolated human groups with traditional diets high in fruits and starchy tubers, which lead to temporary blood glucose elevations, tend to have good health. Fruits and starchy tubers in general are good sources of vitamin C.
Grains and seeds are not.
References
Beuchat, C.A., & Chong, C.R. (1998). Hyperglycemia in hummingbirds and its consequences for hemoglobin glycation. Comparative Biochemistry and Physiology Part A, 120(3), 409–416.
Holmes D.J., Flückiger, R., & Austad, S.N. (2001). Comparative biology of aging in birds: An update. Experimental Gerontology, 36(4), 869-883.
Tuesday, September 28, 2010
Income, obesity, and heart disease in US states
The figure below combines data on median income by state (bottom-left and top-right), as well as a plot of heart disease death rates against percentage of population with body mass index (BMI) greater than 30 percent. The data are recent, and have been provided by CNN.com and creativeclass.com, respectively.

Heart disease deaths and obesity are strongly associated with each other, and both are inversely associated with median income. US states with lower median income tend to have generally higher rates of obesity and heart disease deaths.
The reasons are probably many, complex, and closely interconnected. Low income is usually associated with high rates of stress, depression, smoking, alcoholism, and poor nutrition. Compounding the problem, these are normally associated with consumption of cheap, addictive, highly refined foods.
Interestingly, this is primarily an urban phenomenon. If you were to use hunter-gatherers as your data sources, you would probably see the opposite relationship. For example, non-westernized hunter-gatherers have no income (at least not in the “normal” sense), but typically have a lower incidence of obesity and heart disease than mildly westernized ones. The latter have some income.
Tragically, the first few generations of fully westernized hunter-gatherers usually find themselves in the worst possible spot.

Heart disease deaths and obesity are strongly associated with each other, and both are inversely associated with median income. US states with lower median income tend to have generally higher rates of obesity and heart disease deaths.
The reasons are probably many, complex, and closely interconnected. Low income is usually associated with high rates of stress, depression, smoking, alcoholism, and poor nutrition. Compounding the problem, these are normally associated with consumption of cheap, addictive, highly refined foods.
Interestingly, this is primarily an urban phenomenon. If you were to use hunter-gatherers as your data sources, you would probably see the opposite relationship. For example, non-westernized hunter-gatherers have no income (at least not in the “normal” sense), but typically have a lower incidence of obesity and heart disease than mildly westernized ones. The latter have some income.
Tragically, the first few generations of fully westernized hunter-gatherers usually find themselves in the worst possible spot.
Wednesday, September 22, 2010
Low nonexercise activity thermogenesis: Uncooperative genes or comfy furniture?
The degree of nonexercise activity thermogenesis (NEAT) seems to a major factor influencing the amount of fat gained or lost by an individual. It also seems to be strongly influenced by genetics, because NEAT is largely due to involuntary activities like fidgeting.
But why should this be?
The degree to which different individuals will develop diseases of civilization in response to consumption of refined carbohydrate-rich foods can also be seen as influenced by genetics. After all, there are many people who eat those foods and are thin and healthy, and that appears to be in part a family trait. But whether we consume those products or not is largely within our control.
So, it is quite possible that NEAT is influenced by genetics, but the fact that NEAT is low in so many people should be a red flag. In the same way that the fact that so many people who eat refined carbohydrate-rich foods are obese should be a red flag. Moreover, modern isolated hunter-gatherers tend to have low levels of body fat. Given the importance of NEAT for body fat regulation, it is not unreasonable to assume that NEAT is elevated in hunter-gatherers, compared to modern urbanites. Hunter-gatherers live more like our Paleolithic ancestors than modern urbanites.
True genetic diseases, caused by recent harmful mutations, are usually rare. If low NEAT were truly a genetic “disease”, those with low NEAT should be a small minority. That is not the case. It is more likely that the low NEAT that we see in modern urbanites is due to a maladaptation of our Stone Age body to modern life, in the same way that our Stone Age body is maladapted to the consumption of foods rich in refined grains and seeds.
What could have increased NEAT among our Paleolithic ancestors, and among modern isolated hunter-gatherers?
One thing that comes to mind is lack of comfortable furniture, particularly comfortable chairs (photo below from: prlog.org). It is quite possible that our Paleolithic ancestors invented some rudimentary forms of furniture, but they would have been much less comfortable than modern furniture used in most offices and homes. The padding of comfy office chairs is not very easy to replicate with stones, leaves, wood, or even animal hides. You need engineering to design it; you need industry to produce that kind of thing.

I have been doing a little experiment with myself, where I do things that force me to sit tall and stand while working in my office, instead of sitting back and “relaxing”. Things like putting a pillow on the chair so that I cannot rest my back on it, or placing my computer on an elevated surface so that I am forced to work while standing up. I tend to move a lot more when I do those things, and the movement is largely involuntary. These are small but constant movements, a bit like fidgeting. (It would be interesting to tape myself and actually quantify the amount of movement.)
It seems that one can induce an increase in NEAT, which is largely due to involuntary activities, by doing some voluntary things like placing a pillow on a chair or working while standing up.
Is it possible that the unnaturalness of comfy furniture, and particularly of comfy chairs, is contributing (together with other factors) to not only making us fat but also having low-back problems?
Both obesity and low-back problems are widespread among modern urbanites. Yet, from an evolutionary perspective, they should not be. They likely impaired survival success among our ancestors, and thus impaired their reproductive success. Evolution “gets angry” at these things; over time it wipes them out. In my reading of studies of hunter-gatherers, I don’t recall a single instance in which obesity and low-back problems were described as being widespread.
But why should this be?
The degree to which different individuals will develop diseases of civilization in response to consumption of refined carbohydrate-rich foods can also be seen as influenced by genetics. After all, there are many people who eat those foods and are thin and healthy, and that appears to be in part a family trait. But whether we consume those products or not is largely within our control.
So, it is quite possible that NEAT is influenced by genetics, but the fact that NEAT is low in so many people should be a red flag. In the same way that the fact that so many people who eat refined carbohydrate-rich foods are obese should be a red flag. Moreover, modern isolated hunter-gatherers tend to have low levels of body fat. Given the importance of NEAT for body fat regulation, it is not unreasonable to assume that NEAT is elevated in hunter-gatherers, compared to modern urbanites. Hunter-gatherers live more like our Paleolithic ancestors than modern urbanites.
True genetic diseases, caused by recent harmful mutations, are usually rare. If low NEAT were truly a genetic “disease”, those with low NEAT should be a small minority. That is not the case. It is more likely that the low NEAT that we see in modern urbanites is due to a maladaptation of our Stone Age body to modern life, in the same way that our Stone Age body is maladapted to the consumption of foods rich in refined grains and seeds.
What could have increased NEAT among our Paleolithic ancestors, and among modern isolated hunter-gatherers?
One thing that comes to mind is lack of comfortable furniture, particularly comfortable chairs (photo below from: prlog.org). It is quite possible that our Paleolithic ancestors invented some rudimentary forms of furniture, but they would have been much less comfortable than modern furniture used in most offices and homes. The padding of comfy office chairs is not very easy to replicate with stones, leaves, wood, or even animal hides. You need engineering to design it; you need industry to produce that kind of thing.

I have been doing a little experiment with myself, where I do things that force me to sit tall and stand while working in my office, instead of sitting back and “relaxing”. Things like putting a pillow on the chair so that I cannot rest my back on it, or placing my computer on an elevated surface so that I am forced to work while standing up. I tend to move a lot more when I do those things, and the movement is largely involuntary. These are small but constant movements, a bit like fidgeting. (It would be interesting to tape myself and actually quantify the amount of movement.)
It seems that one can induce an increase in NEAT, which is largely due to involuntary activities, by doing some voluntary things like placing a pillow on a chair or working while standing up.
Is it possible that the unnaturalness of comfy furniture, and particularly of comfy chairs, is contributing (together with other factors) to not only making us fat but also having low-back problems?
Both obesity and low-back problems are widespread among modern urbanites. Yet, from an evolutionary perspective, they should not be. They likely impaired survival success among our ancestors, and thus impaired their reproductive success. Evolution “gets angry” at these things; over time it wipes them out. In my reading of studies of hunter-gatherers, I don’t recall a single instance in which obesity and low-back problems were described as being widespread.
Friday, September 17, 2010
Strong causation can exist without any correlation: The strange case of the chain smokers, and a note about diet
Researchers like to study samples of data and look for associations between variables. Often those associations are represented in the form of correlation coefficients, which go from -1 to 1. Another popular measure of association is the path coefficient, which usually has a narrower range of variation. What many researchers seem to forget is that the associations they find depend heavily on the sample they are looking at, and on the ranges of variation of the variables being analyzed.
A forgotten warning: Causation without correlation
Often those who conduct multivariate statistical analyses on data are unaware of certain limitations. Many times this is due to lack of familiarity with statistical tests. One warning we do see a lot though is: Correlation does not imply causation. This is, of course, absolutely true. If you take my weight from 1 to 20 years of age, and the price of gasoline in the US during that period, you will find that they are highly correlated. But common sense tells me that there is no causation whatsoever between these two variables.
So correlation does not imply causation alright, but there is another warning that is rarely seen: There can be strong causation without any correlation. Of course this can lead to even more bizarre conclusions than the “correlation does not imply causation” problem. If there is strong causation between variables B and Y, and it is not showing as a correlation, another variable A may “jump in” and “steal” that “unused correlation”; so to speak.
The chain smokers “study”
To illustrate this point, let us consider the following fictitious case, a study of “100 cities”. The study focuses on the effect of smoking and genes on lung cancer mortality. Smoking significantly increases the chances of dying from lung cancer; it is a very strong causative factor. Here are a few more details. Between 35 and 40 percent of the population are chain smokers. And there is a genotype (a set of genes), found in a small percentage of the population (around 7 percent), which is protective against lung cancer. All of those who are chain smokers die from lung cancer unless they die from other causes (e.g., accidents). Dying from other causes is a lot more common among those who have the protective genotype.
(I created this fictitious data with these associations in mind, using equations. I also added uncorrelated error into the equations, to make the data look a bit more realistic. For example, random deaths occurring early in life would reduce slightly any numeric association between chain smoking and cancer deaths in the sample of 100 cities.)
The table below shows part of the data, and gives an idea of the distribution of percentage of smokers (Smokers), percentage with the protective genotype (Pgenotype), and percentage of lung cancer deaths (MLCancer). (Click on it to enlarge. Use the "CRTL" and "+" keys to zoom in, and CRTL" and "-" to zoom out.) Each row corresponds to a city. The rest of the data, up to row 100, has a similar distribution.

The graphs below show the distribution of lung cancer deaths against: (a) the percentage of smokers, at the top; and (b) the percentage with the protective genotype, at the bottom. Correlations are shown at the top of each graph. (They can vary from -1 to 1. The closer they are to -1 or 1, the stronger is the association, negative or positive, between the variables.) The correlation between lung cancer deaths and percentage of smokers is slightly negative and statistically insignificant (-0.087). The correlation between lung cancer deaths and percentage with the protective genotype is negative, strong, and statistically significant (-0.613).
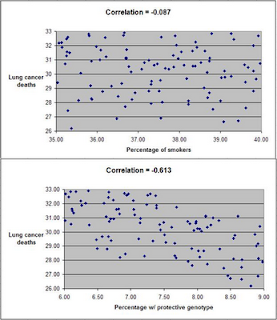
Even though smoking significantly increases the chances of dying from lung cancer, the correlations tell us otherwise. The correlations tell us that lung cancer does not seem to cause lung cancer deaths, and that having the protective genotype seems to significantly decrease cancer deaths. Why?
If there is no variation, there is no correlation
The reason is that the “researchers” collected data only about chain smokers. That is, the variable “Smokers” includes only chain smokers. If this was not a fictitious case, focusing the study on chain smokers could be seen as a clever strategy employed by researchers funded by tobacco companies. The researchers could say something like this: “We focused our analysis on those most likely to develop lung cancer.” Or, this could have been the result of plain stupidity when designing the research project.
By restricting their study to chain smokers the researchers dramatically reduced the variability in one particular variable: the extent to which the study participants smoked. Without variation, there can be no correlation. No matter what statistical test or software is used, no significant association will be found between lung cancer deaths and percentage of smokers based on this dataset. No matter what statistical test or software is used, a significant and strong association will be found between lung cancer deaths and percentage with the protective genotype.
Of course, this could lead to a very misleading conclusion. Smoking does not cause lung cancer; the real cause is genetic.
A note about diet
Consider the analogy between smoking and consumption of a particular food, and you will probably see what this means for the analysis of observational data regarding dietary choices and disease. This applies to almost any observational study, including the China Study. (Studies employing experimental control manipulations would presumably ensure enough variation in the variables studied.) In the China Study, data from dozens of counties were collected. One may find a significant association between consumption of food A and disease Y.
There may be a much stronger association between food B and disease Y, but that association may not show up in statistical analyses at all, simply because there is little variation in the data regarding consumption of food B. For example, all those sampled may have eaten food B; about the same amount. Or none. Or somewhere in between, within a rather small range of variation.
Statistical illiteracy, bad choices, and taxation
Statistics is a “necessary evil”. It is useful to go from small samples to large ones when we study any possible causal association. By doing so, one can find out whether an observed effect really applies to a larger percentage of the population, or is actually restricted to a small group of individuals. The problem is that we humans are very bad at inferring actual associations from simply looking at large tables with numbers. We need statistical tests for that.
However, ignorance about basic statistical phenomena, such as the one described here, can be costly. A group of people may eliminate food A from their diet based on coefficients of association resulting from what seem to be very clever analyses, replacing it with food B. The problem is that food B may be equally harmful, or even more harmful. And, that effect may not show up on statistical analyses unless they have enough variation in the consumption of food B.
Readers of this blog may wonder why we explicitly use terms like “suggests” when we refer to a relationship that is suggested by a significant coefficient of association (e.g., a linear correlation). This is why, among other reasons.
One does not have to be a mathematician to understand basic statistical concepts. And doing so can be very helpful in one’s life in general, not only in diet and lifestyle decisions. Even in simple choices, such as what to be on. We are always betting on something. For example, any investment is essentially a bet. Some outcomes are much more probable than others.
Once I had an interesting conversation with a high-level officer of a state government. I was part of a consulting team working on an information technology project. We were talking about the state lottery, which was a big source of revenue for the state, comparing it with state taxes. He told me something to this effect:
Our lottery is essentially a tax on the statistically illiterate.
A forgotten warning: Causation without correlation
Often those who conduct multivariate statistical analyses on data are unaware of certain limitations. Many times this is due to lack of familiarity with statistical tests. One warning we do see a lot though is: Correlation does not imply causation. This is, of course, absolutely true. If you take my weight from 1 to 20 years of age, and the price of gasoline in the US during that period, you will find that they are highly correlated. But common sense tells me that there is no causation whatsoever between these two variables.
So correlation does not imply causation alright, but there is another warning that is rarely seen: There can be strong causation without any correlation. Of course this can lead to even more bizarre conclusions than the “correlation does not imply causation” problem. If there is strong causation between variables B and Y, and it is not showing as a correlation, another variable A may “jump in” and “steal” that “unused correlation”; so to speak.
The chain smokers “study”
To illustrate this point, let us consider the following fictitious case, a study of “100 cities”. The study focuses on the effect of smoking and genes on lung cancer mortality. Smoking significantly increases the chances of dying from lung cancer; it is a very strong causative factor. Here are a few more details. Between 35 and 40 percent of the population are chain smokers. And there is a genotype (a set of genes), found in a small percentage of the population (around 7 percent), which is protective against lung cancer. All of those who are chain smokers die from lung cancer unless they die from other causes (e.g., accidents). Dying from other causes is a lot more common among those who have the protective genotype.
(I created this fictitious data with these associations in mind, using equations. I also added uncorrelated error into the equations, to make the data look a bit more realistic. For example, random deaths occurring early in life would reduce slightly any numeric association between chain smoking and cancer deaths in the sample of 100 cities.)
The table below shows part of the data, and gives an idea of the distribution of percentage of smokers (Smokers), percentage with the protective genotype (Pgenotype), and percentage of lung cancer deaths (MLCancer). (Click on it to enlarge. Use the "CRTL" and "+" keys to zoom in, and CRTL" and "-" to zoom out.) Each row corresponds to a city. The rest of the data, up to row 100, has a similar distribution.

The graphs below show the distribution of lung cancer deaths against: (a) the percentage of smokers, at the top; and (b) the percentage with the protective genotype, at the bottom. Correlations are shown at the top of each graph. (They can vary from -1 to 1. The closer they are to -1 or 1, the stronger is the association, negative or positive, between the variables.) The correlation between lung cancer deaths and percentage of smokers is slightly negative and statistically insignificant (-0.087). The correlation between lung cancer deaths and percentage with the protective genotype is negative, strong, and statistically significant (-0.613).
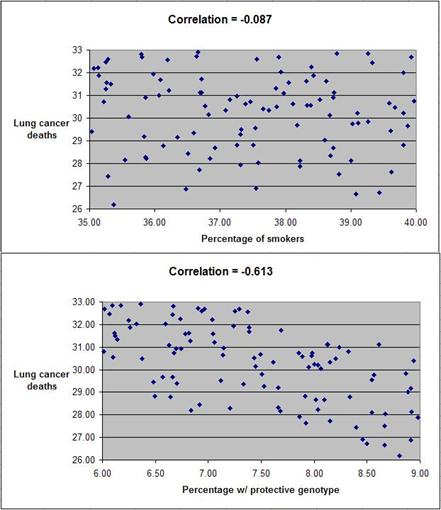
Even though smoking significantly increases the chances of dying from lung cancer, the correlations tell us otherwise. The correlations tell us that lung cancer does not seem to cause lung cancer deaths, and that having the protective genotype seems to significantly decrease cancer deaths. Why?
If there is no variation, there is no correlation
The reason is that the “researchers” collected data only about chain smokers. That is, the variable “Smokers” includes only chain smokers. If this was not a fictitious case, focusing the study on chain smokers could be seen as a clever strategy employed by researchers funded by tobacco companies. The researchers could say something like this: “We focused our analysis on those most likely to develop lung cancer.” Or, this could have been the result of plain stupidity when designing the research project.
By restricting their study to chain smokers the researchers dramatically reduced the variability in one particular variable: the extent to which the study participants smoked. Without variation, there can be no correlation. No matter what statistical test or software is used, no significant association will be found between lung cancer deaths and percentage of smokers based on this dataset. No matter what statistical test or software is used, a significant and strong association will be found between lung cancer deaths and percentage with the protective genotype.
Of course, this could lead to a very misleading conclusion. Smoking does not cause lung cancer; the real cause is genetic.
A note about diet
Consider the analogy between smoking and consumption of a particular food, and you will probably see what this means for the analysis of observational data regarding dietary choices and disease. This applies to almost any observational study, including the China Study. (Studies employing experimental control manipulations would presumably ensure enough variation in the variables studied.) In the China Study, data from dozens of counties were collected. One may find a significant association between consumption of food A and disease Y.
There may be a much stronger association between food B and disease Y, but that association may not show up in statistical analyses at all, simply because there is little variation in the data regarding consumption of food B. For example, all those sampled may have eaten food B; about the same amount. Or none. Or somewhere in between, within a rather small range of variation.
Statistical illiteracy, bad choices, and taxation
Statistics is a “necessary evil”. It is useful to go from small samples to large ones when we study any possible causal association. By doing so, one can find out whether an observed effect really applies to a larger percentage of the population, or is actually restricted to a small group of individuals. The problem is that we humans are very bad at inferring actual associations from simply looking at large tables with numbers. We need statistical tests for that.
However, ignorance about basic statistical phenomena, such as the one described here, can be costly. A group of people may eliminate food A from their diet based on coefficients of association resulting from what seem to be very clever analyses, replacing it with food B. The problem is that food B may be equally harmful, or even more harmful. And, that effect may not show up on statistical analyses unless they have enough variation in the consumption of food B.
Readers of this blog may wonder why we explicitly use terms like “suggests” when we refer to a relationship that is suggested by a significant coefficient of association (e.g., a linear correlation). This is why, among other reasons.
One does not have to be a mathematician to understand basic statistical concepts. And doing so can be very helpful in one’s life in general, not only in diet and lifestyle decisions. Even in simple choices, such as what to be on. We are always betting on something. For example, any investment is essentially a bet. Some outcomes are much more probable than others.
Once I had an interesting conversation with a high-level officer of a state government. I was part of a consulting team working on an information technology project. We were talking about the state lottery, which was a big source of revenue for the state, comparing it with state taxes. He told me something to this effect:
Our lottery is essentially a tax on the statistically illiterate.
Thursday, September 2, 2010
How to lose fat and gain muscle at the same time? Strength training plus a mild caloric deficit
Ballor et al. (1996) conducted a classic and interesting study on body composition changes induced by aerobic and strength training. This study gets cited a lot, but apparently for the wrong reasons. One of these reasons can be gleaned from this sentence in the abstract:
“During the exercise training period, the aerobic training group … had a significant … reduction in body weight … as compared with the [strength] training group ...”
That is, one of the key conclusions of this study was that aerobic training was more effective than strength training as far as weight loss is concerned. (The authors refer to the strength training group as the “weight training group”.)
Prior to starting the exercise programs, the 18 participants had lost a significant amount of weight through dieting, for a period of 11 weeks. The authors do not provide details on the diet, other than that it was based on “healthy” food choices. What this means exactly I am not sure, but my guess is that it was probably not particularly high or low in carbs/fat, included a reasonable amount of protein, and led to a caloric deficit.
The participants were older adults (mean age of 61; range, 56 to 70), who were also obese (mean body fat of 45 percent), but otherwise healthy. They managed to lose an average of 9 kg (about 20 lbs) during that 11-week period.
Following the weight loss period, the participants were randomly assigned to either a 12-week aerobic training (four men, five women) or weight training (four men, five women) exercise program. They exercised 3 days per week. These were whole-body workouts, with emphasis on compound (i.e., multiple-muscle) exercises. The figure below shows what actually happened with the participants.

As you can see, the strength training group (WT) gained about 1.5 kg of lean mass, lost 1.2 kg of fat, and thus gained some weight. The aerobic training group (AT) lost about 0.6 kg of lean mass and 1.8 kg of fat, and thus lost some weight.
Which group fared better? In terms of body composition changes, clearly the strength training group fared better. But my guess is that the participants in the strength training group did not like seeing their weight going up after losing a significant amount of weight through dieting. (An analysis of the possible psychological effects of this would be interesting; a discussion for another blog post.)
The changes in the aerobic training group were predictable, and were the result of compensatory adaptation. Their bodies changed to become better adapted to aerobic exercise, for which a lot of lean mass is a burden, as is a lot of fat mass.
So, essentially the participants in the strength training group lost fat and gained muscle at the same time. The authors say that the participants generally stuck with their weight-loss diet during the 12-week exercise period, but not a very strict away. It is reasonable to conclude that this induced a mild caloric deficit in the participants.
Exercise probably induced hunger, and possibly a caloric surplus on exercise days. If that happened, the caloric deficit must have occurred on non-exercise days. Without some caloric deficit there would not have been fat loss, as extra calories are stored as fat.
There are many self-help books and programs online whose main claim is to have a “revolutionary” prescription for concurrent fat loss and muscle gain – the “holy grail” of body composition change.
Well, it may be as simple as combining strength training with a mild caloric deficit, in the context of a nutritious diet focused on unprocessed foods.
Reference:
Ballor, D.L., Harvey-Berino, J.R., Ades, P.A., Cryan, J., & Calles-Escandon, J. (1996). Contrasting effects of resistance and aerobic training on body composition and metabolism after diet-induced weight loss. Metabolism, 45(2), 179-183.
“During the exercise training period, the aerobic training group … had a significant … reduction in body weight … as compared with the [strength] training group ...”
That is, one of the key conclusions of this study was that aerobic training was more effective than strength training as far as weight loss is concerned. (The authors refer to the strength training group as the “weight training group”.)
Prior to starting the exercise programs, the 18 participants had lost a significant amount of weight through dieting, for a period of 11 weeks. The authors do not provide details on the diet, other than that it was based on “healthy” food choices. What this means exactly I am not sure, but my guess is that it was probably not particularly high or low in carbs/fat, included a reasonable amount of protein, and led to a caloric deficit.
The participants were older adults (mean age of 61; range, 56 to 70), who were also obese (mean body fat of 45 percent), but otherwise healthy. They managed to lose an average of 9 kg (about 20 lbs) during that 11-week period.
Following the weight loss period, the participants were randomly assigned to either a 12-week aerobic training (four men, five women) or weight training (four men, five women) exercise program. They exercised 3 days per week. These were whole-body workouts, with emphasis on compound (i.e., multiple-muscle) exercises. The figure below shows what actually happened with the participants.

As you can see, the strength training group (WT) gained about 1.5 kg of lean mass, lost 1.2 kg of fat, and thus gained some weight. The aerobic training group (AT) lost about 0.6 kg of lean mass and 1.8 kg of fat, and thus lost some weight.
Which group fared better? In terms of body composition changes, clearly the strength training group fared better. But my guess is that the participants in the strength training group did not like seeing their weight going up after losing a significant amount of weight through dieting. (An analysis of the possible psychological effects of this would be interesting; a discussion for another blog post.)
The changes in the aerobic training group were predictable, and were the result of compensatory adaptation. Their bodies changed to become better adapted to aerobic exercise, for which a lot of lean mass is a burden, as is a lot of fat mass.
So, essentially the participants in the strength training group lost fat and gained muscle at the same time. The authors say that the participants generally stuck with their weight-loss diet during the 12-week exercise period, but not a very strict away. It is reasonable to conclude that this induced a mild caloric deficit in the participants.
Exercise probably induced hunger, and possibly a caloric surplus on exercise days. If that happened, the caloric deficit must have occurred on non-exercise days. Without some caloric deficit there would not have been fat loss, as extra calories are stored as fat.
There are many self-help books and programs online whose main claim is to have a “revolutionary” prescription for concurrent fat loss and muscle gain – the “holy grail” of body composition change.
Well, it may be as simple as combining strength training with a mild caloric deficit, in the context of a nutritious diet focused on unprocessed foods.
Reference:
Ballor, D.L., Harvey-Berino, J.R., Ades, P.A., Cryan, J., & Calles-Escandon, J. (1996). Contrasting effects of resistance and aerobic training on body composition and metabolism after diet-induced weight loss. Metabolism, 45(2), 179-183.
Subscribe to:
Posts (Atom)
