
There are two main problems with many of the animal studies of calorie restriction. One is that, as natural lifespan decreases, it becomes progressively easier to experimentally obtain major relative lifespan extensions. (That is, it seems much easier to double the lifespan of an organism whose natural lifespan is one day than an organism whose natural lifespan is 80 years.) The second, and main problem in my mind, is that the studies often compare obese with lean animals.
Obesity clearly reduces lifespan in humans, but that is a different claim than the one that calorie restriction increases lifespan. It has often been claimed that Asian countries and regions where calorie intake is reduced display increased lifespan. And this may well be true, but the question remains as to whether this is due to calorie restriction increasing lifespan, or because the rates of obesity are much lower in countries and regions where calorie intake is reduced.
So, what can the China Study II data tell us about the hypothesis that calorie restriction increases longevity?
As it turns out, we can conduct a preliminary test of this hypothesis based on a key assumption. Let us say we compared two populations (e.g., counties in China), based on the following ratio: number of deaths at or after age 70 divided by number deaths before age 70. Let us call this the “ratio of longevity” of a population, or RLONGEV. The assumption is that the population with the highest RLONGEV would be the population with the highest longevity of the two. The reason is that, as longevity goes up, one would expect to see a shift in death patterns, with progressively more people dying old and fewer people dying young.
The 1989 China Study II dataset has two variables that we can use to estimate RLONGEV. They are coded as M005 and M006, and refer to the mortality rates from 35 to 69 and 70 to 79 years of age, respectively. Unfortunately there is no variable for mortality after 79 years of age, which limits the scope of our results somewhat. (This does not totally invalidate the results because we are using a ratio as our measure of longevity, not the absolute number of deaths from 70 to 79 years of age.) Take a look at these two previous China Study II posts (here, and here) for other notes, most of which apply here as well. The notes are at the end of the posts.
All of the results reported here are from analyses conducted using WarpPLS. Below is a model with coefficients of association; it is a simple model, since the hypothesis that we are testing is also simple. (Click on it to enlarge. Use the "CRTL" and "+" keys to zoom in, and CRTL" and "-" to zoom out.) The arrows explore associations between variables, which are shown within ovals. The meaning of each variable is the following: TKCAL = total calorie intake per day; RLONGEV = ratio of longevity; SexM1F2 = sex, with 1 assigned to males and 2 to females.
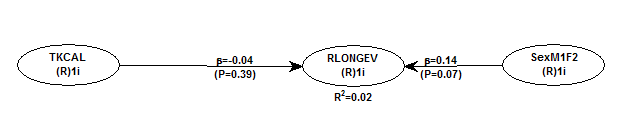
As one would expect, being female is associated with increased longevity, but the association is just shy of being statistically significant in this dataset (beta=0.14; P=0.07). The association between total calorie intake and longevity is trivial, and statistically indistinguishable from zero (beta=-0.04; P=0.39). Moreover, even though this very weak association is overall negative (or inverse), the sign of the association here does not fully reflect the shape of the association. The shape is that of an inverted J-curve; a.k.a. U-curve. When we split the data into total calorie intake terciles we get a better picture:

The second tercile, which refers to a total daily calorie intake of 2193 to 2844 calories, is the one associated with the highest longevity. The first tercile (with the lowest range of calories) is associated with a higher longevity than the third tercile (with the highest range of calories). These results need to be viewed in context. The average weight in this dataset was about 116 lbs. A conservative estimate of the number of calories needed to maintain this weight without any physical activity would be about 1740. Add about 700 calories to that, for a reasonable and healthy level of physical activity, and you get 2440 calories needed daily for weight maintenance. That is right in the middle of the second tercile.
In simple terms, the China Study II data seems to suggest that those who eat well, but not too much, live the longest. Those who eat little have slightly lower longevity. Those who eat too much seem to have the lowest longevity, perhaps because of the negative effects of excessive body fat.
Because these trends are all very weak from a statistical standpoint, we have to take them with caution. What we can say with more confidence is that the China Study II data does not seem to support the hypothesis that calorie restriction increases longevity.
Reference
Kock, N. (2019). WarpPLS User Manual: Version 6.0. Laredo, Texas: ScriptWarp Systems.
Notes
- The path coefficients (indicated as beta coefficients) reflect the strength of the relationships; they are a bit like standard univariate (or Pearson) correlation coefficients, except that they take into consideration multivariate relationships (they control for competing effects on each variable). Whenever nonlinear relationships were modeled, the path coefficients were automatically corrected by the software to account for nonlinearity.
- Only two data points per county were used (for males and females). This increased the sample size of the dataset without artificially reducing variance, which is desirable since the dataset is relatively small (each county, not individual, is a separate data point is this dataset). This also allowed for the test of commonsense assumptions (e.g., the protective effects of being female), which is always a good idea in a multivariate analyses because violation of commonsense assumptions may suggest data collection or analysis error. On the other hand, it required the inclusion of a sex variable as a control variable in the analysis, which is no big deal.
- Mortality from schistosomiasis infection (MSCHIST) does not confound the results presented here. Only counties where no deaths from schistosomiasis infection were reported have been included in this analysis. The reason for this is that mortality from schistosomiasis infection can severely distort the results in the age ranges considered here. On the other hand, removal of counties with deaths from schistosomiasis infection reduced the sample size, and thus decreased the statistical power of the analysis.


