
This post has been revised and re-published. The original comments are preserved below.
Thursday, December 30, 2010
Thursday, December 16, 2010
Maknig to mayn tipos? Myabe ur teh boz
Undoubtedly one of the big differences between life today and in our Paleolithic past is the level of stress that modern humans face on a daily basis. Much stress happens at work, which is very different from what our Paleolithic ancestors would call work. Modern office work, in particular, would probably be seen as a form of slavery by our Paleolithic ancestors.
Some recent research suggests that organizational power distance is a big factor in work-related stress. Power distance is essentially the degree to which bosses and subordinates accept wide differences in organizational power between them (Hofstede, 2001).

I have been studying the topic of information overload for a while. It is a fascinating topic. People who experience it have the impression that they have more information to process than they can handle. They also experience significant stress as a result of it, and both the quality of their work and their productivity goes down.
Recently some colleagues and I conducted a study that included employees from companies in New Zealand, Spain, and the USA (Kock, Del Aguila-Obra & Padilla-Meléndez, 2009). These are countries whose organizations typically display significant differences in power distance. We found something unexpected. Information overload was much more strongly associated with power distance than with the actual amount of information employees had to process on a daily basis.
While looking for explanations to this paradoxical finding, I recalled an interview I gave way back in 2001 to the Philadelphia Inquirer, commenting on research by Dr. David A. Owens. His research uncovered an interesting phenomenon. The higher up in the organizational pecking order one was, the less the person was concerned about typos on emails to subordinates.
There is also some cool research by Carlson & Davis (1998) suggesting that bosses tend to pick the communication media that are the most convenient for them, and don’t care much about convenience for the subordinates. One example would be calling a subordinate on the phone to assign a task, and then demanding a detailed follow-up report by email.
As a side note, writing a reasonably sized email takes a lot longer than conveying the same ideas over the phone or face-to-face (Kock, 2005). To be more precise, it takes about 10 times longer when the word count is over 250 and the ideas being conveyed are somewhat complex. For very short messages, a written medium like email is fairly convenient, and the amount of time to convey ideas may be even shorter than by using the phone or doing it face-to-face.
So a picture started to emerge. Bosses choose the communication media that are convenient for them when dealing with subordinates. If the media are written, they don’t care about typos at all. The subordinates use the media that are imposed on them, and if the media are written they certainly don’t want something with typos coming from them to reach their bosses. It would make them look bad.
The final result is this. Subordinates experience significant information overload, particularly in high power distance organizations. They also experience significant stress. Work quality and productivity goes down, and they get even more stressed. They get fat, or sickly thin. Their health deteriorates. Eventually they get fired, which doesn’t help a bit.
What should you do, if you are not the boss? Here are some suggestions:
- Try to tactfully avoid letting communication media being imposed on you all the time by your boss (and others). Explicitly state, in a polite way, the media that would be most convenient for you in various circusmtances, both as a receiver and sender. Generally, media that support oral speech are better for discussing complex ideas. Written media are better for short exchanges. Want an evolutionary reason for that? As you wish: Kock (2004).
- Discuss the ideas in this post with your boss; assuming that the person cares. Perhaps there is something that can be done to reduce power distance, for example. Making the work environment more democratic seems to help in some cases.
- And ... dot’n wrory soo mach aobut tipos ... which could be extrapolated to: don’t sweat the small stuff. Most bosses really care about results, and will gladly take an email with some typos telling them that a new customer signed a contract. They will not be as happy with an email telling them the opposite, no matter how well written it is.
Otherwise, your organizational demise may come sooner than you think.
References
Carlson, P.J., & Davis, G.B. (1998). An investigation of media selection among directors and managers: From "self" to "other" orientation. MIS Quarterly, 22(3), 335-362.
Hofstede, G. (2001). Culture’s consequences: Comparing values, behaviors, institutions, and organizations across nations. Thousand Oaks, CA: Sage.
Kock, N. (2004). The psychobiological model: Towards a new theory of computer-mediated communication based on Darwinian evolution. Organization Science, 15(3), 327-348.
Kock, N. (2005). Business process improvement through e-collaboration: Knowledge sharing through the use of virtual groups. Hershey, PA: Idea Group Publishing.
Kock, N., Del Aguila-Obra, A.R., & Padilla-Meléndez, A. (2009). The information overload paradox: A structural equation modeling analysis of data from New Zealand, Spain and the U.S.A. Journal of Global Information Management, 17(3), 1-17.
Some recent research suggests that organizational power distance is a big factor in work-related stress. Power distance is essentially the degree to which bosses and subordinates accept wide differences in organizational power between them (Hofstede, 2001).
(Source: talentedapps.wordpress.com)
I have been studying the topic of information overload for a while. It is a fascinating topic. People who experience it have the impression that they have more information to process than they can handle. They also experience significant stress as a result of it, and both the quality of their work and their productivity goes down.
Recently some colleagues and I conducted a study that included employees from companies in New Zealand, Spain, and the USA (Kock, Del Aguila-Obra & Padilla-Meléndez, 2009). These are countries whose organizations typically display significant differences in power distance. We found something unexpected. Information overload was much more strongly associated with power distance than with the actual amount of information employees had to process on a daily basis.
While looking for explanations to this paradoxical finding, I recalled an interview I gave way back in 2001 to the Philadelphia Inquirer, commenting on research by Dr. David A. Owens. His research uncovered an interesting phenomenon. The higher up in the organizational pecking order one was, the less the person was concerned about typos on emails to subordinates.
There is also some cool research by Carlson & Davis (1998) suggesting that bosses tend to pick the communication media that are the most convenient for them, and don’t care much about convenience for the subordinates. One example would be calling a subordinate on the phone to assign a task, and then demanding a detailed follow-up report by email.
As a side note, writing a reasonably sized email takes a lot longer than conveying the same ideas over the phone or face-to-face (Kock, 2005). To be more precise, it takes about 10 times longer when the word count is over 250 and the ideas being conveyed are somewhat complex. For very short messages, a written medium like email is fairly convenient, and the amount of time to convey ideas may be even shorter than by using the phone or doing it face-to-face.
So a picture started to emerge. Bosses choose the communication media that are convenient for them when dealing with subordinates. If the media are written, they don’t care about typos at all. The subordinates use the media that are imposed on them, and if the media are written they certainly don’t want something with typos coming from them to reach their bosses. It would make them look bad.
The final result is this. Subordinates experience significant information overload, particularly in high power distance organizations. They also experience significant stress. Work quality and productivity goes down, and they get even more stressed. They get fat, or sickly thin. Their health deteriorates. Eventually they get fired, which doesn’t help a bit.
What should you do, if you are not the boss? Here are some suggestions:
- Try to tactfully avoid letting communication media being imposed on you all the time by your boss (and others). Explicitly state, in a polite way, the media that would be most convenient for you in various circusmtances, both as a receiver and sender. Generally, media that support oral speech are better for discussing complex ideas. Written media are better for short exchanges. Want an evolutionary reason for that? As you wish: Kock (2004).
- Discuss the ideas in this post with your boss; assuming that the person cares. Perhaps there is something that can be done to reduce power distance, for example. Making the work environment more democratic seems to help in some cases.
- And ... dot’n wrory soo mach aobut tipos ... which could be extrapolated to: don’t sweat the small stuff. Most bosses really care about results, and will gladly take an email with some typos telling them that a new customer signed a contract. They will not be as happy with an email telling them the opposite, no matter how well written it is.
Otherwise, your organizational demise may come sooner than you think.
References
Carlson, P.J., & Davis, G.B. (1998). An investigation of media selection among directors and managers: From "self" to "other" orientation. MIS Quarterly, 22(3), 335-362.
Hofstede, G. (2001). Culture’s consequences: Comparing values, behaviors, institutions, and organizations across nations. Thousand Oaks, CA: Sage.
Kock, N. (2004). The psychobiological model: Towards a new theory of computer-mediated communication based on Darwinian evolution. Organization Science, 15(3), 327-348.
Kock, N. (2005). Business process improvement through e-collaboration: Knowledge sharing through the use of virtual groups. Hershey, PA: Idea Group Publishing.
Kock, N., Del Aguila-Obra, A.R., & Padilla-Meléndez, A. (2009). The information overload paradox: A structural equation modeling analysis of data from New Zealand, Spain and the U.S.A. Journal of Global Information Management, 17(3), 1-17.
Saturday, December 11, 2010
Strength training: A note about Scooby and comments by Anon
Let me start this post with a note about Scooby, who is a massive bodybuilder who has a great website with tips on how to exercise at home without getting injured. Scooby is probably as massive a bodybuilder as anyone can get naturally, and very lean. He says he is a natural bodybuilder, and I am inclined to believe him. His dietary advice is “old school” and would drive many of the readers of this blog crazy – e.g., plenty of grains, and six meals a day. But it obviously works for him. (As far as muscle gain is concerned, a lot of different approaches work. For some people, almost any reasonable approach will work; especially if they are young men with high testosterone levels.)
The text below is all from an anonymous commenter’s notes on this post discussing the theory of supercompensation. Many thanks to this person for the detailed and thoughtful comment, which is a good follow-up on the note above about Scooby. In fact I thought that the comment might have been from Scooby; but I don’t think so. My additions are within “[ ]”. While the comment is there under the previous post for everyone to see, I thought that it deserved a separate post.
I love this subject [i.e., strength training]. No shortages of opinions backed by research with the one disconcerting detail that they don't agree.
First one opening general statement. If there was one right way we'd all know it by now and we'd all be doing it. People's bodies are different and what motivates them is different. (Motivation matters as a variable.)
My view on one set vs. three is based on understanding what you're measuring and what you're after in a training result.
Most studies look at one rep max strength gains as the metric but three sets [of repetitions] improves strength/endurance. People need strength/endurance more typically than they need maximal strength in their daily living. The question here becomes what is your goal?
The next thing I look at in training is neural adaptation. Not from the point of view of simple muscle strength gain but from the point of view of coordinated muscle function, again, something that is transferable to real life. When you exercise the brain is always learning what it is you are asking it to do. What you need to ask yourself is how well does this exercise correlate with a real life requirements.
[This topic needs a separate post, but one can reasonably argue that your brain works a lot harder during a one-hour strength training session than during a one-hour session in which you are solving a difficult mathematical problem.]
To this end single legged squats are vastly superior to double legged squats. They invoke balance and provoke the activation of not only the primary movers but the stabilization muscles as well. The brain is acquiring a functional skill in activating all these muscles in proper harmony and improving balance.
I also like walking lunges at the climbing wall in the gym (when not in use, of course) as the instability of the soft foam at the base of the wall gives an excellent boost to the basic skill by ramping up the important balance/stabilization component (vestibular/stabilization muscles). The stabilization muscles protect joints (inner unit vs. outer unit).
The balance and single leg components also increase core activation naturally. (See single legged squat and quadratus lumborum for instance.) [For more on the quadratus lumborum muscle, see here.]
Both [of] these exercises can be done with dumbbells for increased strength[;] and though leg exercises strictly speaking, they ramp up the core/full body aspect with weights in hand.
I do multiple sets, am 59 years old and am stronger now than I have ever been (I have hit personal bests in just the last month) and have been exercising for decades. I vary my rep ranges between six and fifteen (but not limited to just those two extremes). My total exercise volume is between two and three hours a week.
Because I have been at this a long time I have learned to read my broad cycles. I push during the peak periods and back off during the valleys. I also adjust to good days and bad days within the broader cycle.
It is complex but natural movements with high neural skill components and complete muscle activation patterns that have moved me into peak condition while keeping me from injury.
I do not exercise to failure but stay in good form for all reps. I avoid full range of motion because it is a distortion of natural movement. Full range of motion with high loads in particular tends to damage joints.
Natural, functional strength is more complex than the simple study designs typically seen in the literature.
Hopefully these things that I have learned through many years of experimentation will be of interest to you, Ned, and your readers, and will foster some experimentation of your own.
Anonymous
The text below is all from an anonymous commenter’s notes on this post discussing the theory of supercompensation. Many thanks to this person for the detailed and thoughtful comment, which is a good follow-up on the note above about Scooby. In fact I thought that the comment might have been from Scooby; but I don’t think so. My additions are within “[ ]”. While the comment is there under the previous post for everyone to see, I thought that it deserved a separate post.
***
I love this subject [i.e., strength training]. No shortages of opinions backed by research with the one disconcerting detail that they don't agree.
First one opening general statement. If there was one right way we'd all know it by now and we'd all be doing it. People's bodies are different and what motivates them is different. (Motivation matters as a variable.)
My view on one set vs. three is based on understanding what you're measuring and what you're after in a training result.
Most studies look at one rep max strength gains as the metric but three sets [of repetitions] improves strength/endurance. People need strength/endurance more typically than they need maximal strength in their daily living. The question here becomes what is your goal?
The next thing I look at in training is neural adaptation. Not from the point of view of simple muscle strength gain but from the point of view of coordinated muscle function, again, something that is transferable to real life. When you exercise the brain is always learning what it is you are asking it to do. What you need to ask yourself is how well does this exercise correlate with a real life requirements.
[This topic needs a separate post, but one can reasonably argue that your brain works a lot harder during a one-hour strength training session than during a one-hour session in which you are solving a difficult mathematical problem.]
To this end single legged squats are vastly superior to double legged squats. They invoke balance and provoke the activation of not only the primary movers but the stabilization muscles as well. The brain is acquiring a functional skill in activating all these muscles in proper harmony and improving balance.
I also like walking lunges at the climbing wall in the gym (when not in use, of course) as the instability of the soft foam at the base of the wall gives an excellent boost to the basic skill by ramping up the important balance/stabilization component (vestibular/stabilization muscles). The stabilization muscles protect joints (inner unit vs. outer unit).
The balance and single leg components also increase core activation naturally. (See single legged squat and quadratus lumborum for instance.) [For more on the quadratus lumborum muscle, see here.]
Both [of] these exercises can be done with dumbbells for increased strength[;] and though leg exercises strictly speaking, they ramp up the core/full body aspect with weights in hand.
I do multiple sets, am 59 years old and am stronger now than I have ever been (I have hit personal bests in just the last month) and have been exercising for decades. I vary my rep ranges between six and fifteen (but not limited to just those two extremes). My total exercise volume is between two and three hours a week.
Because I have been at this a long time I have learned to read my broad cycles. I push during the peak periods and back off during the valleys. I also adjust to good days and bad days within the broader cycle.
It is complex but natural movements with high neural skill components and complete muscle activation patterns that have moved me into peak condition while keeping me from injury.
I do not exercise to failure but stay in good form for all reps. I avoid full range of motion because it is a distortion of natural movement. Full range of motion with high loads in particular tends to damage joints.
Natural, functional strength is more complex than the simple study designs typically seen in the literature.
Hopefully these things that I have learned through many years of experimentation will be of interest to you, Ned, and your readers, and will foster some experimentation of your own.
Anonymous
Monday, December 6, 2010
Pressure-cooked meat: Top sirloin
Pressure cooking relies on physics to take advantage of the high temperatures of liquids and vapors in a sealed container. The sealed container is the pressure-cooking pan. Since the sealed container does not allow liquids or vapors to escape, the pressure inside the container increases as heat is applied to the pan. This also significantly increases the temperature of the liquids and vapors inside the container, which speeds up cooking.
Pressure cooking is essentially a version of high-heat steaming. The food inside the cooker tends to be very evenly cooked. Pressure cooking is also considered to be one of the most effective cooking methods for killing food-born pathogens. Since high pressure reduces cooking time, pressure cooking is usually employed in industrial food processing.
When cooking meat, the amount of pressure used tends to affect amino-acid digestibility; more pressure decreases digestibility. High pressures in the cooker cause high temperatures. The content of some vitamins in meat and plant foods is also affected; they go down as pressure goes up. Home pressure cookers are usually set at 15 pounds per square inch (psi). Significant losses in amino-acid digestibility occur only at pressures of 30 psi or higher.
My wife and I have been pressure-cooking for quite some time. Below is a simple recipe, for top sirloin.
- Prepare some dry seasoning powder by mixing sea salt, garlic power, chili powder, and a small amount of cayenne pepper.
- Season the top sirloin pieces at least 2 hours prior to placing them in the pressure cooking pan.
- Place the top sirloin pieces in the pressure cooking pan, and add water, almost to the point of covering them.
- Cook on very low fire, after the right amount of pressure is achieved, for 1 hour. The point at which the right amount of pressure is obtained is signaled by the valve at the top of the pan making a whistle-like noise.
As with slow cooking in an open pan, the water around the cuts should slowly turn into a fatty and delicious sauce, which you can pour on the meat when serving, to add flavor. The photos below show the seasoned top sirloin pieces, the (old) pressure-cooking pan we use, and some cooked pieces ready to be eaten together with some boiled yam.


A 100 g portion will have about 30 g of protein. (That is a bit less than 4 oz, cooked.) The amount of fat will depend on how trimmed the cuts are. Like most beef cuts, the fat will be primarily saturated and monounsatured, with approximately equal amounts of each. It will provide good amounts of the following vitamins and minerals: iron, magnesium, niacin, phosphorus, potassium, zinc, selenium, vitamin B6, and vitamin B12.
Thursday, December 2, 2010
How lean should one be?
Loss of muscle mass is associated with aging. It is also associated with the metabolic syndrome, together with excessive body fat gain. It is safe to assume that having low muscle and high fat mass, at the same time, is undesirable.
The extreme opposite of that, achievable though natural means, would be to have as much muscle as possible and as low body fat as possible. People who achieve that extreme often look a bit like “buff skeletons”.
This post assumes that increasing muscle mass through strength training and proper nutrition is healthy. It looks into body fat levels, specifically how low body fat would have to be for health to be maximized.
I am happy to acknowledge that quite often I am working on other things and then become interested in a topic that is brought up by Richard Nikoley, and discussed by his readers (I am one of them). This post is a good example of that.
Obesity and the diseases of civilization
Obesity is strongly associated with the diseases of civilization, of which the prototypical example is perhaps type 2 diabetes. So much so that sometimes the impression one gets is that without first becoming obese, one cannot develop any of the diseases of civilization.
But this is not really true. For example, diabetes type 1 is also one of the diseases of civilization, and it often strikes thin people. Diabetes type 1 results from the destruction of the beta cells in the pancreas by a person’s own immune system. The beta cells in the pancreas produce insulin, which regulates blood glucose levels.
Still, obesity is undeniably a major risk factor for the diseases of civilization. It seems reasonable to want to move away from it. But how much? How lean should one be to be as healthy as possible? Given the ubiquity of U-curve relationships among health variables, there should be a limit below which health starts deteriorating.
Is the level of body fat of the gentleman on the photo below (from: ufcbettingtoday.com) low enough? His name is Fedor; more on him below. I tend to admire people who excel in narrow fields, be they intellectual or sport-related, even if I do not do anything remotely similar in my spare time. I admire Fedor.

Let us look at some research and anecdotal evidence to see if we can answer the question above.
The buff skeleton look is often perceived as somewhat unattractive
Being in the minority is not being wrong, but should make one think. Like Richard Nikoley’s, my own perception of the physique of men and women is that, the leaner they are, the better; as long as they also have a reasonable amount of muscle. That is, in my mind, the look of a stage-ready competitive natural bodybuilder is close to the healthiest look possible.
The majority’s opinion, however, seems different, at least anecdotally. The majority of women that I hear or read voicing their opinions on this matter seem to find the “buff skeleton” look somewhat unattractive, compared with a more average fit or athletic look. The same seems to be true for perceptions of males about females.
A little side note. From an evolutionary perspective, perceptions of ancestral women about men must have been much more important than perceptions of ancestral men about women. The reason is that the ancestral women were the ones applying sexual selection pressures in our ancestral past.
For the sake of discussion, let us define the buff skeleton look as one of a reasonably muscular person with a very low body fat percentage; pretty much only essential fat. That would be 10-13 percent for women, and 5-8 percent for men.
The average fit look would be 21-24 percent for women, and 14-17 percent for men. Somewhere in between, would be what we could call the athletic look, namely 14-20 percent for women, and 6-13 percent for men. These levels are exactly the ones posted on this Wikipedia article on body fat percentages, at the time of writing.
From an evolutionary perspective, attractiveness to members of the opposite sex should be correlated with health. Unless we are talking about a costly trait used in sexual selection by our ancestors; something analogous to the male peacock’s train.
But costly traits are usually ornamental, and are often perceived as attractive even in exaggerated forms. What prevents male peacock trains from becoming the size of a mountain is that they also impair survival. Otherwise they would keep growing. The peahens find them sexy.
Being ripped is not always associated with better athletic performance
Then there is the argument that if you carried some extra fat around the waist, then you would not be able to fight, hunt etc. as effectively as you could if you were living 500,000 years ago. Evolution does not “like” that, so it is an unnatural and maladaptive state achieved by modern humans.
Well, certainly the sport of mixed martial arts (MMA) is not the best point of comparison for Paleolithic life, but it is not such a bad model either. Look at this photo of Fedor Emelianenko (on the left, clearly not so lean) next to Andrei Arlovski (fairly lean). Fedor is also the one on the photo at the beginning of this post.
Fedor weighed about 220 lbs at 6’; Arlovski 250 lbs at 6’4’’. In fact, Arlovski is one of the leanest and most muscular MMA heavyweights, and also one of the most highly ranked. Now look at Fedor in action (see this YouTube video), including what happened when Fedor fought Arlovski, at around the 4:28 mark. Fedor won by knockout.
Both Fedor and Arlovski are heavyweights; which means that they do not have to “make weight”. That is, they do not have to lose weight to abide by the regulations of their weight category. Since both are professional MMA fighters, among the very best in the world, the weight at which they compete is generally the weight that is associated with their best performance.
Fedor was practically unbeaten until recently, even though he faced a very high level of competition. Before Fedor there was another professional fighter that many thought was from Russia, and who ruled the MMA heavyweight scene for a while. His name is Igor Vovchanchyn, and he is from the Ukraine. At 5’8’’ and 230 lbs in his prime, he was a bit chubby. This YouTube video shows him in action; and it is brutal.
A BMI of about 25 seems to be the healthiest for long-term survival
Then we have this post by Stargazey, a blogger who likes science. Toward the end the post she discusses a study suggesting that a body mass index (BMI) of about 25 seems to be the healthiest for long-term survival. That BMI is between normal weight and overweight. The study suggests that both being underweight or obese is unhealthy, in terms of long-term survival.
The BMI is calculated as an individual’s body weight divided by the square of the individual’s height. A limitation of its use here is that the BMI is a more reliable proxy for body fat percentage for women than for men, and can be particularly misleading when applied to muscular men.
The traditional Okinawans are not super lean
The traditional Okinawans (here is a good YouTube video) are the longest living people in the world. Yet, they are not super lean, not even close. They are not obese either. The traditional Okinawans are those who kept to their traditional diet and lifestyle, which seems to be less and less common these days.
There are better videos on the web that could be used to illustrate this point. Some even showing shirtless traditional karate instructors and students from Okinawa, which I had seen before but could not find again. Nearly all of those karate instructors and students were a bit chubby, but not obese. By the way, karate was invented in Okinawa.
The fact that the traditional Okinawans are not ripped does not mean that the level of fat that is healthy for them is also healthy for someone with a different genetic makeup. It is important to remember that the traditional Okinawans share a common ancestry.
What does this all mean?
Some speculation below, but before that let me tell this: as counterintuitive as it may sound, excessive abdominal fat may be associated with higher insulin sensitivity in some cases. This post discusses a study in which the members of a treatment group were more insulin sensitive than the members of a control group, even though the former were much fatter; particularly in terms of abdominal fat.
It is possible that the buff skeleton look is often perceived as somewhat unattractive because of cultural reasons, and that it is associated with the healthiest state for humans. However, it seems a bit unlikely that this applies as a general rule to everybody.
Another possibility, which appears to be more reasonable, is that the buff skeleton look is healthy for some, and not for others. After all, body fat percentage, like fat distribution, seems to be strongly influenced by our genes. We can adapt in ways that go against genetic pressures, but that may be costly in some cases.
There is a great deal of genetic variation in the human species, and much of it may be due to relatively recent evolutionary pressures.
Life is not that simple!
References
Buss, D.M. (1995). The evolution of desire: Strategies of human mating. New York, NY: Basic Books.
Cartwright, J. (2000). Evolution and human behavior: Darwinian perspectives on human nature. Cambridge, MA: The MIT Press.
Miller, G.F. (2000). The mating mind: How sexual choice shaped the evolution of human nature. New York, NY: Doubleday.
Zahavi, A. & Zahavi, A. (1997). The Handicap Principle: A missing piece of Darwin’s puzzle. Oxford, England: Oxford University Press.
Sunday, November 28, 2010
HealthCorrelator for Excel 1.0 (HCE): Call for beta testers
This call is closed. Beta testing has been successfully completed. HealthCorrelator for Excel (HCE) is now publicly available for download and use on a free trial basis. For those users who decide to buy it after trying, licenses are available for individuals and organizations.
To download a free trial version – as well as get the User Manual, view demo YouTube videos, and download and try sample datasets – visit the HealthCorrelator.com web site.
To download a free trial version – as well as get the User Manual, view demo YouTube videos, and download and try sample datasets – visit the HealthCorrelator.com web site.
Monday, November 22, 2010
Human traits are distributed along bell curves: You need to know yourself, and HCE can help
Most human traits (e.g., body fat percentage, blood pressure, propensity toward depression) are influenced by our genes; some more than others. The vast majority of traits are also influenced by environmental factors, the “nurture” part of the “nature-nurture” equation. Very few traits are “innate”, such as blood type.
This means that manipulating environmental factors, such as diet and lifestyle, can strongly influence how the traits are finally expressed in humans. But each individual tends to respond differently to diet and lifestyle changes, because each individual is unique in terms of his or her combination of “nature” and “nurture”. Even identical twins are different in that respect.
When plotted, traits that are influenced by our genes are distributed along a bell-shaped curve. For example, a trait like body fat percentage, when measured in a population of 1000 individuals, will yield a distribution of values that will look like a bell-shaped distribution. This type of distribution is also known in statistics as a “normal” distribution.
Why is that?
The additive effect of genes and the bell curve
The reason is purely mathematical. A measurable trait, like body fat percentage, is usually influenced by several genes. (Sometimes individual genes have a very marked effect, as in genes that “switch on or off” other genes.) Those genes appear at random in a population, and their various combinations spread in response to selection pressures. Selection pressures usually cause a narrowing of the bell-shaped curve distributions of traits in populations.
The genes interact with environmental influences, which also have a certain degree of randomness. The result is a massive combined randomness. It is this massive randomness that leads to the bell-curve distribution. The bell curve itself is not random at all, which is a fascinating aspect of this phenomenon. From “chaos” comes “order”. A bell curve is a well-defined curve that is associated with a function, the probability density function.
The underlying mathematical reason for the bell shape is the central limit theorem. The genes are combined in different individuals as combinations of alleles, where each allele is a variation (or mutation) of a gene. An allele set, for genes in different locations of the human DNA, forms a particular allele combination, called a genotype. The alleles combine their effects, usually in an additive fashion, to influence a trait.
Here is a simple illustration. Let us say one generates 1000 random variables, each storing 10 random values going from 0 to 1. Then the values stored in each of the 1000 random variables are added. This mimics the additive effect of 10 genes with random allele combinations. The result are numbers ranging from 1 to 10, in a population of 1000 individuals; each number is analogous to an allele combination. The resulting histogram, which plots the frequency of each allele combination (or genotype) in the population, is shown on the figure bellow. Each allele configuration will “push for” a particular trait range, making the trait distribution also have the same bell-shaped form.

The bell curve, research studies, and what they mean for you
Studies of the effects of diet and exercise on health variables usually report their results in terms of average responses in a group of participants. Frequently two groups are used, one control and one treatment. For example, in a diet-related study the control group may follow the Standard American Diet, and the treatment group may follow a low carbohydrate diet.
However, you are not the average person; the average person is an abstraction. Research on bell curve distributions tells us that there is about a 68 percentage chance that you will fall within a 1 standard deviation from the average, to the left or the right of the “middle” of the bell curve. Still, even a 0.5 standard deviation above the average is not the average. And, there is approximately a 32 percent chance that you will not be within the larger -1 to 1 standard deviation range. If this is the case, the average results reported may be close to irrelevant for you.
Average results reported in studies are a good starting point for people who are similar to the studies’ participants. But you need to generate your own data, with the goal of “knowing yourself through numbers” by progressively analyzing it. This is akin to building a “numeric diary”. It is not exactly an “N=1” experiment, as some like to say, because you can generate multiple data points (e.g., N=200) on how your body alone responds to diet and lifestyle changes over time.
HealthCorrelator for Excel (HCE)
I think I have finally been able to develop a software tool that can help people do that. I have been using it myself for years, initially as a prototype. You can see the results of my transformation on this post. The challenge for me was to generate a tool that was simple enough to use, and yet powerful enough to give people good insights on what is going on with their body.
The software tool is called HealthCorrelator for Excel (HCE). It runs on Excel, and generates coefficients of association (correlations, which range from -1 to 1) among variables and graphs at the click of a button.
This 5-minute YouTube video shows how the software works in general, and this 10-minute video goes into more detail on how the software can be used to manage a specific health variable. These two videos build on a very small sample dataset, and their focus is on HDL cholesterol management. Nevertheless, the software can be used in the management of just about any health-related variable – e.g., blood glucose, triglycerides, muscle strength, muscle mass, depression episodes etc.
You have to enter data about yourself, and then the software will generate coefficients of association and graphs at the click of a button. As you can see from the videos above, it is very simple. The interpretation of the results is straightforward in most cases, and a bit more complicated in a smaller number of cases. Some results will probably surprise users, and their doctors.
For example, a user who is a patient may be able to show to a doctor that, in the user’s specific case, a diet change influences a particular variable (e.g., triglycerides) much more strongly than a prescription drug or a supplement. More posts will be coming in the future on this blog about these and other related issues.
Monday, November 15, 2010
Your mind as an anabolic steroid
The figure below, taken from Wilmore et al. (2007), is based on a classic 1972 study conducted by Ariel and Saville. The study demonstrated the existence of what is referred to in exercise physiology as the “placebo effect on muscular strength gains”. The study had two stages. In the first stage, fifteen male university athletes completed a 7-week strength training program. Gains in strength occurred during this period, but were generally small as these were trained athletes.

In the second stage the same participants completed a 4-week strength training program, very much like the previous one (in the first stage). The difference was that some of them took placebos they believed to be anabolic steroids. Significantly greater gains in strength occurred during this second stage for those individuals, even though this stage was shorter in duration (4 weeks). The participants in this classic study increased their strength gains due to one main reason. They strongly believed it would happen.
Again, these were trained athletes; see the maximum weights lifted on the left, which are not in pounds but kilograms. For trained athletes, gains in strength are usually associated with gains in muscle mass. The gains may not look like much, and seem to be mostly in movements involving big muscle groups. Still, if you look carefully, you will notice that the bench press gain is of around 10-15 kg. This is a gain of 22-33 lbs, in a little less than one month!
This classic study has several implications. One is that if someone tells you that a useless supplement will lead to gains from strength training, and you believe that, maybe the gains will indeed happen. This study also provides indirect evidence that “psyching yourself up” for each strength training session may indeed be very useful, as many serious bodybuilders do. It is also reasonable to infer from this study that if you believe that you will not achieve gains from strength training, that belief may become reality.
As a side note, androgenic-anabolic steroids, better known as “anabolic steroids” or simply “steroids”, are synthetic derivatives of the hormone testosterone. Testosterone is present in males and females, but it is usually referred to as a male hormone because it is found in much higher concentrations in males than females.
Steroids have many negative side effects, particularly when taken in large quantities and for long periods of time. They tend to work only when taken in doses above a certain threshold (Wilmore et al., 2007); results below that threshold may actually be placebo effects. The effective thresholds for steroids tend to be high enough to lead to negative health side effects for most people. Still, they are used by bodybuilders as an effective aid to muscle gain, because they do lead to significant muscle gain in high doses. Adding to the negative side effects, steroids do not usually prevent fat gain.
References
Ariel, G., & Saville, W. (1972). Anabolic steroids: The physiological effects of placebos. Medicine and Science in Sports and Exercise, 4(2), 124-126.
Wilmore, J.H., Costill, D.L., & Kenney, W.L. (2007). Physiology of sport and exercise. Champaign, IL: Human Kinetics.
Monday, November 8, 2010
High-heat cooking will AGE you, if you eat food deep-fried with industrial vegetable oils
As I said before on this blog, I am yet to be convinced that grilled meat is truly unhealthy in the absence of leaky gut problems. I am referring here to high heat cooking-induced Maillard reactions (browning) and the resulting advanced glycation endproducts (AGEs). Whenever you cook a food in high heat, to the point of browning it, you generate a Maillard reaction. Searing and roasting meat usually leads to that.
Elevated levels of serum AGEs presumably accelerate the aging process in humans. This is supported by research with uncontrolled diabetics, who seem to have elevated levels of serum AGEs. In fact, a widely used measure in the treatment of diabetes, the HbA1c (or percentage of glycated hemoglobin), is actually a measure of endogenous AGE formation. (Endogenous = generated by our own bodies.)
Still, evidence that a person with an uncompromised gut can cause serum levels of AGEs to go up significantly by eating AGEs is weak, and evidence that any related serum AGE increases lead the average person to develop health problems is pretty much nonexistent. The human body can handle AGEs, as long as their concentration is not too high. We cannot forget that a healthy HbA1c in humans is about 5 percent; meaning that AGEs are created and dealt with by our bodies. A healthy HbA1c in humans is not 0 percent.
Thanks again to Justin for sending me the full text version of the Birlouez-Aragon et al. (2010) article, which is partially reviewed here. See this post and the comments under it for some background on this discussion. The article is unequivocally titled: “A diet based on high-heat-treated foods promotes risk factors for diabetes mellitus and cardiovascular diseases.”
This article is recent, and has already been cited by news agencies and bloggers as providing “definitive” evidence that high-heat cooking is bad for one’s health. Interestingly, quite a few of those citations are in connection with high-heat cooking of meat, which is not even the focus of the article.
In fact, the Birlouez-Aragon et al. (2010) article provides no evidence that high-heat cooking of meat leads to AGEing in humans. If anything, the article points at the use of industrial vegetable oils for cooking as the main problem. And we know already that industrial vegetable oils are not healthy, whether you cook with them or drink them cold by the tablespoon.
But there are a number of good things about this article. For example, the authors summarize past research on AGEs. They focus on MRPs, which are “Maillard reaction products”. One of the summary statements supports what I have said on this blog before:
"The few human intervention trials […] that reported on health effects of dietary MRPs have all focused on patients with diabetes or renal failure."
That is, there is no evidence from human studies that dietary AGEs cause health problems outside the context of preexisting conditions that themselves seem to be associated with endogenous AGE production. To that I would add that gut permeability may also be a problem, as in celiacs ingesting large amounts of AGEs.
As you can see from the quote below, the authors decided to focus their investigation on a particular type of AGE, namely CML or carboxymethyllysine.
"...we decided to specifically quantify CML, as a well-accepted MRP indicator ..."
As I noted in my comments under this post (the oven roasted pork tenderloin post), one particular type of diet seems to lead to high serum CML levels – a vegetarian diet.
So let us see what the authors studied:
"... we conducted a randomized, crossover, intervention trial to clarify whether a habitual diet containing high-heat-treated foods, such as deep-fried potatoes, cookies, brown crusted bread, or fried meat, could promote risk factors of type 2 diabetes or cardiovascular diseases in healthy people."
Well, “deep-fried potatoes” is a red flag, don’t you think? They don’t say what oil was used for deep-frying, but I bet it was not coconut or olive oil. Cheap industrial vegetable oils (corn, safflower etc.) are the ones normally used (and re-used) for deep-frying. This is in part because these oils are cheap, and in part because they have high “smoke points” (the temperature at which the oil begins to generate smoke).
Let us see what else the authors say about the dietary conditions they compared:
"The STD was prepared by using conventional techniques such as grilling, frying, and roasting and contained industrial food known to be highly cooked, such as extruded corn flakes, coffee, dry cookies, and well-baked bread with brown crust. In contrast, the STMD comprised some raw food and foods that were cooked with steam techniques only. In addition, convenience products were chosen according to the minimal process applied (ie, steamed corn flakes, tea, sponge cakes, and mildly baked bread) ..."
The STD diet was the one with high-heat preparation of foods; in the STMD diet the foods were all steam-cooked at relatively low temperatures. Clearly these diets were mostly of plant-based foods, and of the unhealthy kind!
The following quote, from the results, pretty much tells us that the high omega-6 content of industrial oils used for deep frying was likely to be a major confounder, if not the main culprit:
"... substantial differences in the plasma fatty acid profile with higher plasma concentrations of long-chain omega-3 fatty acids […] and lower concentrations of omega-6 fatty acids […] were analyzed in the STMD group compared with in the STD group."
That is, the high-heat cooking group had higher plasma concentrations of omega-6 fats, which is what you would expect from a group consuming a large amount of industrial vegetable oils. One single tablespoon per day is already a large amount; these folks were probably consuming more than that.
Perhaps a better title for this study would have been: “A diet based on foods deep-fried in industrial vegetable oils promotes risk factors for diabetes mellitus and cardiovascular diseases.”
This study doesn’t even get close to indicting charred meat as a major source of serum AGEs. But it is not an exception among studies that many claim to do so.
Reference
H Birlouez-Aragon, I., Saavedra, G., Tessier, F.J., Galinier, A., Ait-Ameur, L., Lacoste, F., Niamba, C.-N., Alt, N., Somoza, V., & Lecerf, J.-M. (2010). A diet based on high-heat-treated foods promotes risk factors for diabetes mellitus and cardiovascular diseases. The American Journal of Clinical Nutrition, 91(5), 1220-1226.
Tuesday, October 19, 2010
Slow-cooked meat: Round steak, not grilled, but slow-cooked in a frying pan
I am yet to be convinced that grilled meat is truly unhealthy in the absence of leaky gut problems. I am referring here to high heat cooking-induced Maillard reactions and the resulting advanced glycation endproducts (AGEs). If you are interested, see this post and the comments under it, where I looked into some references provided by an anonymous commenter. In short, I am more concerned about endogenous (i.e., inside the body) formation of AGEs than with exogenous (e.g., dietary) intake.
Still, the other day I had to improvise when cooking meat, and used a cooking method that is considered by many to be fairly healthy – slow-cooking at a low temperature. I seasoned a few pieces of beef tenderloin (filet mignon) for the grill, but it started raining, so I decided to slow-cook them in a frying pan with water and some olive oil. After about 1 hour of slow-cooking, and somewhat to my surprise, they tasted more delicious than grilled!
I have since been using this method more and more, with all types of cuts of meat. It is great for round steak and top sirloin, for example, as well as cuts that come with bone. The pieces of meat come off the bone very easily, are soft, and taste great. So does much of the marrow. You also end up with a delicious sauce. Almost any cut of beef end up very soft when slow-cooked, even cuts that would normally come out from a grill a bit hard. Below is a simple recipe, for round steak (a.k.a. eye round).
- Prepare some dry seasoning powder by mixing sea salt, black pepper, dried garlic bits, chili powder, and a small amount of cayenne pepper.
- Season the round steak pieces at least 2 hours prior to placing them in the pan.
- Add a bit of water and olive oil to one or more frying pans. Two frying pans may be needed, depending on their size and the amount of meat.
- Place the round steak pieces in the frying pan, and add more water, almost to the point of covering them.
- Cook on low fire covered for 2-3 hours.
Since you will be cooking with low fire, the water will probably not evaporate completely even after 3 h. Nevertheless it is a good idea to check it every 15-30 min to make sure that this is the case, because in dry weather the water may evaporate rather fast. The water around the cuts should slowly turn into a fatty and delicious sauce, which you can pour on the meat when serving, to add flavor. The photos below show seasoned round steak pieces in a frying pan before cooking, and some cooked pieces served with sweet potatoes, orange pieces and a nectarine.


A 100 g portion will have about 34 g of protein. (A 100 g portion is a bit less than 4 oz, cooked.) The amount of fat will depend on how trimmed the cuts are. Like most beef cuts, the fat will be primarily saturated and monounsatured (both very healthy), with approximately equal amounts of each. It will provide good amounts of the following vitamins and minerals: iron, niacin, phosphorus, potassium, zinc, selenium, vitamin B6, and vitamin B12.
Monday, October 11, 2010
Blood glucose levels in birds are high yet HbA1c levels are low: Can vitamin C have anything to do with this?
Blood glucose levels in birds are often 2-4 times higher than those in mammals of comparable size. Yet birds often live 3 times longer than mammals of comparable size. This is paradoxical. High glucose levels are generally associated with accelerated senescence, but birds seem to age much slower than mammals. Several explanations have been proposed for this, one of which is related to the formation of advanced glycation endproducts (AGEs).
Glycation is a process whereby sugar molecules “stick” to protein or fat molecules, impairing their function. Glycation leads to the formation of AGEs, which seem to be associated with a host of diseases, including diabetes, and to be implicated in accelerated aging (or “ageing”, with British spelling).
The graphs below, from Beuchat & Chong (1998), show the glucose levels (at rest and prior to feeding) and HbA1c levels (percentage of glycated hemoglobin) in birds and mammals. HbA1c is a measure of the degree of glycation of hemoglobin, a protein found in red blood cells. As such HbA1c (given in percentages) is a good indicator of the rate of AGE formation within an animal’s body.

The glucose levels are measured in mmol/l; they should be multiplied by 18 to obtain the respective measures in mg/dl. For example, the 18 mmol/l glucose level for the Anna’s (a hummingbird species) is equivalent to 324 mg/dl. Even at that high level, well above the level of a diabetic human, the Anna’s hummingbird species has an HbA1c of less than 5, which is lower than that for most insulin sensitive humans.
How can that be?
There are a few possible reasons. Birds seem to have evolved better mechanisms to control cell permeability to glucose, allowing glucose to enter cells very selectively. Birds also seem to have a higher turnover of cells where glycation and thus AGE formation results. The lifespan of red blood cells in birds, for example, is only 50 to 70 percent that of mammals.
But one of the most interesting mechanisms is vitamin C synthesis. Not only is vitamin C a powerful antioxidant, but it also has the ability to reversibly bind to proteins at the sites where glycation would occur. That is, vitamin C has the potential to significantly reduce glycation. The vast majority of birds and mammals can synthesize vitamin C. Humans are an exception. They have to get it from their diet.
This may be one of the many reasons why isolated human groups with traditional diets high in fruits and starchy tubers, which lead to temporary blood glucose elevations, tend to have good health. Fruits and starchy tubers in general are good sources of vitamin C.
Grains and seeds are not.
References
Beuchat, C.A., & Chong, C.R. (1998). Hyperglycemia in hummingbirds and its consequences for hemoglobin glycation. Comparative Biochemistry and Physiology Part A, 120(3), 409–416.
Holmes D.J., Flückiger, R., & Austad, S.N. (2001). Comparative biology of aging in birds: An update. Experimental Gerontology, 36(4), 869-883.
Tuesday, September 28, 2010
Income, obesity, and heart disease in US states
The figure below combines data on median income by state (bottom-left and top-right), as well as a plot of heart disease death rates against percentage of population with body mass index (BMI) greater than 30 percent. The data are recent, and have been provided by CNN.com and creativeclass.com, respectively.

Heart disease deaths and obesity are strongly associated with each other, and both are inversely associated with median income. US states with lower median income tend to have generally higher rates of obesity and heart disease deaths.
The reasons are probably many, complex, and closely interconnected. Low income is usually associated with high rates of stress, depression, smoking, alcoholism, and poor nutrition. Compounding the problem, these are normally associated with consumption of cheap, addictive, highly refined foods.
Interestingly, this is primarily an urban phenomenon. If you were to use hunter-gatherers as your data sources, you would probably see the opposite relationship. For example, non-westernized hunter-gatherers have no income (at least not in the “normal” sense), but typically have a lower incidence of obesity and heart disease than mildly westernized ones. The latter have some income.
Tragically, the first few generations of fully westernized hunter-gatherers usually find themselves in the worst possible spot.
Wednesday, September 22, 2010
Low nonexercise activity thermogenesis: Uncooperative genes or comfy furniture?
The degree of nonexercise activity thermogenesis (NEAT) seems to a major factor influencing the amount of fat gained or lost by an individual. It also seems to be strongly influenced by genetics, because NEAT is largely due to involuntary activities like fidgeting.
But why should this be?
The degree to which different individuals will develop diseases of civilization in response to consumption of refined carbohydrate-rich foods can also be seen as influenced by genetics. After all, there are many people who eat those foods and are thin and healthy, and that appears to be in part a family trait. But whether we consume those products or not is largely within our control.
So, it is quite possible that NEAT is influenced by genetics, but the fact that NEAT is low in so many people should be a red flag. In the same way that the fact that so many people who eat refined carbohydrate-rich foods are obese should be a red flag. Moreover, modern isolated hunter-gatherers tend to have low levels of body fat. Given the importance of NEAT for body fat regulation, it is not unreasonable to assume that NEAT is elevated in hunter-gatherers, compared to modern urbanites. Hunter-gatherers live more like our Paleolithic ancestors than modern urbanites.
True genetic diseases, caused by recent harmful mutations, are usually rare. If low NEAT were truly a genetic “disease”, those with low NEAT should be a small minority. That is not the case. It is more likely that the low NEAT that we see in modern urbanites is due to a maladaptation of our Stone Age body to modern life, in the same way that our Stone Age body is maladapted to the consumption of foods rich in refined grains and seeds.
What could have increased NEAT among our Paleolithic ancestors, and among modern isolated hunter-gatherers?
One thing that comes to mind is lack of comfortable furniture, particularly comfortable chairs (photo below from: prlog.org). It is quite possible that our Paleolithic ancestors invented some rudimentary forms of furniture, but they would have been much less comfortable than modern furniture used in most offices and homes. The padding of comfy office chairs is not very easy to replicate with stones, leaves, wood, or even animal hides. You need engineering to design it; you need industry to produce that kind of thing.

I have been doing a little experiment with myself, where I do things that force me to sit tall and stand while working in my office, instead of sitting back and “relaxing”. Things like putting a pillow on the chair so that I cannot rest my back on it, or placing my computer on an elevated surface so that I am forced to work while standing up. I tend to move a lot more when I do those things, and the movement is largely involuntary. These are small but constant movements, a bit like fidgeting. (It would be interesting to tape myself and actually quantify the amount of movement.)
It seems that one can induce an increase in NEAT, which is largely due to involuntary activities, by doing some voluntary things like placing a pillow on a chair or working while standing up.
Is it possible that the unnaturalness of comfy furniture, and particularly of comfy chairs, is contributing (together with other factors) to not only making us fat but also having low-back problems?
Both obesity and low-back problems are widespread among modern urbanites. Yet, from an evolutionary perspective, they should not be. They likely impaired survival success among our ancestors, and thus impaired their reproductive success. Evolution “gets angry” at these things; over time it wipes them out. In my reading of studies of hunter-gatherers, I don’t recall a single instance in which obesity and low-back problems were described as being widespread.
Friday, September 17, 2010
Strong causation can exist without any correlation: The strange case of the chain smokers, and a note about diet
Researchers like to study samples of data and look for associations between variables. Often those associations are represented in the form of correlation coefficients, which go from -1 to 1. Another popular measure of association is the path coefficient, which usually has a narrower range of variation. What many researchers seem to forget is that the associations they find depend heavily on the sample they are looking at, and on the ranges of variation of the variables being analyzed.
A forgotten warning: Causation without correlation
Often those who conduct multivariate statistical analyses on data are unaware of certain limitations. Many times this is due to lack of familiarity with statistical tests. One warning we do see a lot though is: Correlation does not imply causation. This is, of course, absolutely true. If you take my weight from 1 to 20 years of age, and the price of gasoline in the US during that period, you will find that they are highly correlated. But common sense tells me that there is no causation whatsoever between these two variables.
So correlation does not imply causation alright, but there is another warning that is rarely seen: There can be strong causation without any correlation. Of course this can lead to even more bizarre conclusions than the “correlation does not imply causation” problem. If there is strong causation between variables B and Y, and it is not showing as a correlation, another variable A may “jump in” and “steal” that “unused correlation”; so to speak.
The chain smokers “study”
To illustrate this point, let us consider the following fictitious case, a study of “100 cities”. The study focuses on the effect of smoking and genes on lung cancer mortality. Smoking significantly increases the chances of dying from lung cancer; it is a very strong causative factor. Here are a few more details. Between 35 and 40 percent of the population are chain smokers. And there is a genotype (a set of genes), found in a small percentage of the population (around 7 percent), which is protective against lung cancer. All of those who are chain smokers die from lung cancer unless they die from other causes (e.g., accidents). Dying from other causes is a lot more common among those who have the protective genotype.
(I created this fictitious data with these associations in mind, using equations. I also added uncorrelated error into the equations, to make the data look a bit more realistic. For example, random deaths occurring early in life would reduce slightly any numeric association between chain smoking and cancer deaths in the sample of 100 cities.)
The table below shows part of the data, and gives an idea of the distribution of percentage of smokers (Smokers), percentage with the protective genotype (Pgenotype), and percentage of lung cancer deaths (MLCancer). (Click on it to enlarge. Use the "CRTL" and "+" keys to zoom in, and CRTL" and "-" to zoom out.) Each row corresponds to a city. The rest of the data, up to row 100, has a similar distribution.

The graphs below show the distribution of lung cancer deaths against: (a) the percentage of smokers, at the top; and (b) the percentage with the protective genotype, at the bottom. Correlations are shown at the top of each graph. (They can vary from -1 to 1. The closer they are to -1 or 1, the stronger is the association, negative or positive, between the variables.) The correlation between lung cancer deaths and percentage of smokers is slightly negative and statistically insignificant (-0.087). The correlation between lung cancer deaths and percentage with the protective genotype is negative, strong, and statistically significant (-0.613).
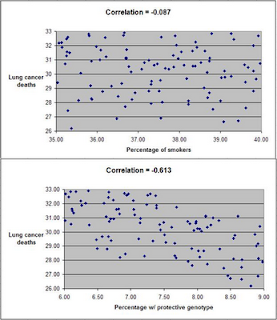
Even though smoking significantly increases the chances of dying from lung cancer, the correlations tell us otherwise. The correlations tell us that lung cancer does not seem to cause lung cancer deaths, and that having the protective genotype seems to significantly decrease cancer deaths. Why?
If there is no variation, there is no correlation
The reason is that the “researchers” collected data only about chain smokers. That is, the variable “Smokers” includes only chain smokers. If this was not a fictitious case, focusing the study on chain smokers could be seen as a clever strategy employed by researchers funded by tobacco companies. The researchers could say something like this: “We focused our analysis on those most likely to develop lung cancer.” Or, this could have been the result of plain stupidity when designing the research project.
By restricting their study to chain smokers the researchers dramatically reduced the variability in one particular variable: the extent to which the study participants smoked. Without variation, there can be no correlation. No matter what statistical test or software is used, no significant association will be found between lung cancer deaths and percentage of smokers based on this dataset. No matter what statistical test or software is used, a significant and strong association will be found between lung cancer deaths and percentage with the protective genotype.
Of course, this could lead to a very misleading conclusion. Smoking does not cause lung cancer; the real cause is genetic.
A note about diet
Consider the analogy between smoking and consumption of a particular food, and you will probably see what this means for the analysis of observational data regarding dietary choices and disease. This applies to almost any observational study, including the China Study. (Studies employing experimental control manipulations would presumably ensure enough variation in the variables studied.) In the China Study, data from dozens of counties were collected. One may find a significant association between consumption of food A and disease Y.
There may be a much stronger association between food B and disease Y, but that association may not show up in statistical analyses at all, simply because there is little variation in the data regarding consumption of food B. For example, all those sampled may have eaten food B; about the same amount. Or none. Or somewhere in between, within a rather small range of variation.
Statistical illiteracy, bad choices, and taxation
Statistics is a “necessary evil”. It is useful to go from small samples to large ones when we study any possible causal association. By doing so, one can find out whether an observed effect really applies to a larger percentage of the population, or is actually restricted to a small group of individuals. The problem is that we humans are very bad at inferring actual associations from simply looking at large tables with numbers. We need statistical tests for that.
However, ignorance about basic statistical phenomena, such as the one described here, can be costly. A group of people may eliminate food A from their diet based on coefficients of association resulting from what seem to be very clever analyses, replacing it with food B. The problem is that food B may be equally harmful, or even more harmful. And, that effect may not show up on statistical analyses unless they have enough variation in the consumption of food B.
Readers of this blog may wonder why we explicitly use terms like “suggests” when we refer to a relationship that is suggested by a significant coefficient of association (e.g., a linear correlation). This is why, among other reasons.
One does not have to be a mathematician to understand basic statistical concepts. And doing so can be very helpful in one’s life in general, not only in diet and lifestyle decisions. Even in simple choices, such as what to be on. We are always betting on something. For example, any investment is essentially a bet. Some outcomes are much more probable than others.
Once I had an interesting conversation with a high-level officer of a state government. I was part of a consulting team working on an information technology project. We were talking about the state lottery, which was a big source of revenue for the state, comparing it with state taxes. He told me something to this effect:
Our lottery is essentially a tax on the statistically illiterate.
A forgotten warning: Causation without correlation
Often those who conduct multivariate statistical analyses on data are unaware of certain limitations. Many times this is due to lack of familiarity with statistical tests. One warning we do see a lot though is: Correlation does not imply causation. This is, of course, absolutely true. If you take my weight from 1 to 20 years of age, and the price of gasoline in the US during that period, you will find that they are highly correlated. But common sense tells me that there is no causation whatsoever between these two variables.
So correlation does not imply causation alright, but there is another warning that is rarely seen: There can be strong causation without any correlation. Of course this can lead to even more bizarre conclusions than the “correlation does not imply causation” problem. If there is strong causation between variables B and Y, and it is not showing as a correlation, another variable A may “jump in” and “steal” that “unused correlation”; so to speak.
The chain smokers “study”
To illustrate this point, let us consider the following fictitious case, a study of “100 cities”. The study focuses on the effect of smoking and genes on lung cancer mortality. Smoking significantly increases the chances of dying from lung cancer; it is a very strong causative factor. Here are a few more details. Between 35 and 40 percent of the population are chain smokers. And there is a genotype (a set of genes), found in a small percentage of the population (around 7 percent), which is protective against lung cancer. All of those who are chain smokers die from lung cancer unless they die from other causes (e.g., accidents). Dying from other causes is a lot more common among those who have the protective genotype.
(I created this fictitious data with these associations in mind, using equations. I also added uncorrelated error into the equations, to make the data look a bit more realistic. For example, random deaths occurring early in life would reduce slightly any numeric association between chain smoking and cancer deaths in the sample of 100 cities.)
The table below shows part of the data, and gives an idea of the distribution of percentage of smokers (Smokers), percentage with the protective genotype (Pgenotype), and percentage of lung cancer deaths (MLCancer). (Click on it to enlarge. Use the "CRTL" and "+" keys to zoom in, and CRTL" and "-" to zoom out.) Each row corresponds to a city. The rest of the data, up to row 100, has a similar distribution.

The graphs below show the distribution of lung cancer deaths against: (a) the percentage of smokers, at the top; and (b) the percentage with the protective genotype, at the bottom. Correlations are shown at the top of each graph. (They can vary from -1 to 1. The closer they are to -1 or 1, the stronger is the association, negative or positive, between the variables.) The correlation between lung cancer deaths and percentage of smokers is slightly negative and statistically insignificant (-0.087). The correlation between lung cancer deaths and percentage with the protective genotype is negative, strong, and statistically significant (-0.613).
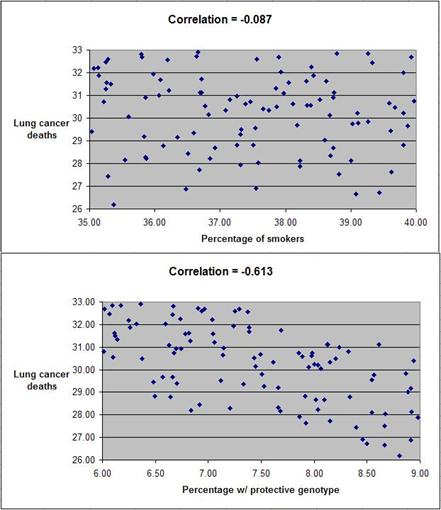
Even though smoking significantly increases the chances of dying from lung cancer, the correlations tell us otherwise. The correlations tell us that lung cancer does not seem to cause lung cancer deaths, and that having the protective genotype seems to significantly decrease cancer deaths. Why?
If there is no variation, there is no correlation
The reason is that the “researchers” collected data only about chain smokers. That is, the variable “Smokers” includes only chain smokers. If this was not a fictitious case, focusing the study on chain smokers could be seen as a clever strategy employed by researchers funded by tobacco companies. The researchers could say something like this: “We focused our analysis on those most likely to develop lung cancer.” Or, this could have been the result of plain stupidity when designing the research project.
By restricting their study to chain smokers the researchers dramatically reduced the variability in one particular variable: the extent to which the study participants smoked. Without variation, there can be no correlation. No matter what statistical test or software is used, no significant association will be found between lung cancer deaths and percentage of smokers based on this dataset. No matter what statistical test or software is used, a significant and strong association will be found between lung cancer deaths and percentage with the protective genotype.
Of course, this could lead to a very misleading conclusion. Smoking does not cause lung cancer; the real cause is genetic.
A note about diet
Consider the analogy between smoking and consumption of a particular food, and you will probably see what this means for the analysis of observational data regarding dietary choices and disease. This applies to almost any observational study, including the China Study. (Studies employing experimental control manipulations would presumably ensure enough variation in the variables studied.) In the China Study, data from dozens of counties were collected. One may find a significant association between consumption of food A and disease Y.
There may be a much stronger association between food B and disease Y, but that association may not show up in statistical analyses at all, simply because there is little variation in the data regarding consumption of food B. For example, all those sampled may have eaten food B; about the same amount. Or none. Or somewhere in between, within a rather small range of variation.
Statistical illiteracy, bad choices, and taxation
Statistics is a “necessary evil”. It is useful to go from small samples to large ones when we study any possible causal association. By doing so, one can find out whether an observed effect really applies to a larger percentage of the population, or is actually restricted to a small group of individuals. The problem is that we humans are very bad at inferring actual associations from simply looking at large tables with numbers. We need statistical tests for that.
However, ignorance about basic statistical phenomena, such as the one described here, can be costly. A group of people may eliminate food A from their diet based on coefficients of association resulting from what seem to be very clever analyses, replacing it with food B. The problem is that food B may be equally harmful, or even more harmful. And, that effect may not show up on statistical analyses unless they have enough variation in the consumption of food B.
Readers of this blog may wonder why we explicitly use terms like “suggests” when we refer to a relationship that is suggested by a significant coefficient of association (e.g., a linear correlation). This is why, among other reasons.
One does not have to be a mathematician to understand basic statistical concepts. And doing so can be very helpful in one’s life in general, not only in diet and lifestyle decisions. Even in simple choices, such as what to be on. We are always betting on something. For example, any investment is essentially a bet. Some outcomes are much more probable than others.
Once I had an interesting conversation with a high-level officer of a state government. I was part of a consulting team working on an information technology project. We were talking about the state lottery, which was a big source of revenue for the state, comparing it with state taxes. He told me something to this effect:
Our lottery is essentially a tax on the statistically illiterate.
Thursday, September 2, 2010
How to lose fat and gain muscle at the same time? Strength training plus a mild caloric deficit
Ballor et al. (1996) conducted a classic and interesting study on body composition changes induced by aerobic and strength training. This study gets cited a lot, but apparently for the wrong reasons. One of these reasons can be gleaned from this sentence in the abstract:
“During the exercise training period, the aerobic training group … had a significant … reduction in body weight … as compared with the [strength] training group ...”
That is, one of the key conclusions of this study was that aerobic training was more effective than strength training as far as weight loss is concerned. (The authors refer to the strength training group as the “weight training group”.)
Prior to starting the exercise programs, the 18 participants had lost a significant amount of weight through dieting, for a period of 11 weeks. The authors do not provide details on the diet, other than that it was based on “healthy” food choices. What this means exactly I am not sure, but my guess is that it was probably not particularly high or low in carbs/fat, included a reasonable amount of protein, and led to a caloric deficit.
The participants were older adults (mean age of 61; range, 56 to 70), who were also obese (mean body fat of 45 percent), but otherwise healthy. They managed to lose an average of 9 kg (about 20 lbs) during that 11-week period.
Following the weight loss period, the participants were randomly assigned to either a 12-week aerobic training (four men, five women) or weight training (four men, five women) exercise program. They exercised 3 days per week. These were whole-body workouts, with emphasis on compound (i.e., multiple-muscle) exercises. The figure below shows what actually happened with the participants.

As you can see, the strength training group (WT) gained about 1.5 kg of lean mass, lost 1.2 kg of fat, and thus gained some weight. The aerobic training group (AT) lost about 0.6 kg of lean mass and 1.8 kg of fat, and thus lost some weight.
Which group fared better? In terms of body composition changes, clearly the strength training group fared better. But my guess is that the participants in the strength training group did not like seeing their weight going up after losing a significant amount of weight through dieting. (An analysis of the possible psychological effects of this would be interesting; a discussion for another blog post.)
The changes in the aerobic training group were predictable, and were the result of compensatory adaptation. Their bodies changed to become better adapted to aerobic exercise, for which a lot of lean mass is a burden, as is a lot of fat mass.
So, essentially the participants in the strength training group lost fat and gained muscle at the same time. The authors say that the participants generally stuck with their weight-loss diet during the 12-week exercise period, but not a very strict away. It is reasonable to conclude that this induced a mild caloric deficit in the participants.
Exercise probably induced hunger, and possibly a caloric surplus on exercise days. If that happened, the caloric deficit must have occurred on non-exercise days. Without some caloric deficit there would not have been fat loss, as extra calories are stored as fat.
There are many self-help books and programs online whose main claim is to have a “revolutionary” prescription for concurrent fat loss and muscle gain – the “holy grail” of body composition change.
Well, it may be as simple as combining strength training with a mild caloric deficit, in the context of a nutritious diet focused on unprocessed foods.
Reference:
Ballor, D.L., Harvey-Berino, J.R., Ades, P.A., Cryan, J., & Calles-Escandon, J. (1996). Contrasting effects of resistance and aerobic training on body composition and metabolism after diet-induced weight loss. Metabolism, 45(2), 179-183.
Tuesday, August 31, 2010
How to become diabetic in 6 hours!? Thanks Dr. Delgado for bringing science to the masses!
(Note: My apologies for the sarcastic tone of this post. I am not really congratulating anybody here!)
Dr. Nick Delgado shows us in this YouTube video how to "become diabetic" in 6 hours!
I must admit that I liked the real-time microscope imaging, and wish he had shown us more of that.
But really!
After consulting with my mentor, the MIMIW, I was reminded that there is at least one post on this blog that shows how one can "become diabetic" in just over 60 minutes – that is, about 6 times faster than using the technique described by Dr. Delgado.
The technique used in the post mentioned above is called "intense exercise", which is even believed to be health-promoting! (Unlike drinking olive oil as if it was water, or eating white bread.)
The advantage of this technique is that one can "become diabetic" by doing something healthy!
Thanks Dr. Delgado, your video ranks high up there, together with this Ali G. video, as a fine example of how to bring real science to the masses.
Sunday, August 29, 2010
Friday, August 13, 2010
The evolution of costly traits: Competing for women can be unhealthy for men
There are human traits that evolved in spite of being survival handicaps. These counterintuitive traits are often called costly traits, or Zahavian traits (in animal signaling contexts), in honor of the evolutionary biologist Amotz Zahavi (Zahavi & Zahavi, 1997). I have written a post about this type of traits, and also an academic article (Kock, 2009). The full references and links to these publications are at the end of this post.
The classic example of costly trait is the peacock’s train, which is used by males to signal health to females. (Figure below from: animals.howstuffworks.com.) The male peacock’s train (often incorrectly called “tail”) is a costly trait because it impairs the ability of a male to flee predators. It decreases a male’s survival success, even though it has a positive net effect on the male’s reproductive success (i.e., the number of offspring it generates). It is used in sexual selection; the females find big and brightly colored trains with many eye spots "sexy".

So costly traits exist in many species, including the human species, but we have not identified them all yet. The implication for human diet and lifestyle choices is that our ancestors might have evolved some habits that are bad for human survival, and moved away from others that are good for survival. And I am not only talking about survival among modern humans; I am talking about survival among our human ancestors too.
The simple reason for the existence of costly traits in humans is that evolution tends to maximize reproductive success, not survival, and that applies to all species. (Inclusive fitness theory goes a step further, placing the gene at the center of the selection process, but this is a topic for another post.) If that were not the case, rodent species, as well as other species that specialize in fast reproduction within relatively short life spans, would never have evolved.
Here is an interesting piece of news about research done at the University of Michigan. (I have met the lead researcher, Dan Kruger, a couple of times at HBES conferences. My impression is that his research is solid.) The research illustrates the evolution of costly traits, from a different angle. The researchers argue, based on the results of their investigation, that competing for a woman’s attention is generally bad for a man’s health!
Very romantic ...
References:
Kock, N. (2009). The evolution of costly traits through selection and the importance of oral speech in e-collaboration. Electronic Markets, 19(4), 221-232.
Zahavi, A. & Zahavi, A. (1997). The Handicap Principle: A missing piece of Darwin’s puzzle. Oxford, England: Oxford University Press.
Tuesday, August 10, 2010
Nonexercise activities like fidgeting may account for a 1,000 percent difference in body fat gain! NEAT eh?
Some studies become classics in their fields and yet are largely missed by the popular media. This seems to be what happened with a study by Levine and colleagues (1999; full reference and link at the end of this post), which looked at the role that nonexercise activity thermogenesis (NEAT) plays in fat gain suppression. Many thanks go to Lyle McDonald for posting on this.
You have probably seen on the web claims that overeating leads to fat loss, because overeating increases one’s basal metabolic rate. There are also claims that food has a powerful thermic effect, due to the energy needed for digestion, absorption and storage of nutrients; this is also claimed to lead to fat loss. There is some truth to these claims, but the related effects are very small compared with the effects of NEAT.
Ever wonder why there are some folks who seem to eat whatever they want, and never get fat? As it turns out, it may be primarily due to NEAT!
NEAT is associated with fidgeting, maintenance of posture, shifting position, pacing, and other involuntary light physical activities. The main finding of this study was that NEAT accounted for a massive amount of the difference in body fat gain among the participants in the study. The participants were 12 males and 4 females, ranging in age from 25 to 36 years. These healthy and lean participants were fed 1,000 kilocalories per day in excess of their weight-maintenance requirements, for a period of 8 weeks. See figure below; click on it to enlarge.

Fat gain varied more than 10-fold among the participants (or more than 1,000 percent), ranging from a gain of only 0.36 kg (0.79 lbs) to a gain of 4.23 kg (9.33 lbs). As you can see, NEAT explains a lot of the variance in the fat gain variable, which is indicated by the highly statistically significant negative correlation (-0.77). Its effect dwarfs those related to basal metabolic rate and food-induced thermogenesis, neither of which was statistically significant.
How can one use this finding in practice? This research indirectly suggests that moving often throughout the day may have a significant additive long term effect on fat gain suppression. It is reasonable to expect a similar effect on fat loss. And this effect may be stealthy enough to prevent the body from reacting to fat loss by significantly lowering its basal metabolic rate. (Yes, while the increase in basal metabolic rate is trivial in response to overfeeding, the decrease in this rate is nontrivial in response to underfeeding. Essentially the body is much more “concerned” about starving than fattening up.)
The bad news is that it is not easy to mimic the effects of NEAT through voluntary activities. The authors of the study estimated that the maximum increase in NEAT detected in the study (692 kcal/day) would be equivalent to a 15-minute walk every waking hour of every single day! (This other study focuses specifically on fidgeting.) Clearly NEAT has a powerful effect on weight loss, which is not easy to match with voluntary pacing, standing up etc. Moreover, females seem to benefit less from NEAT, because they seem to engage in fewer NEAT-related activities than men. The four lowest NEAT values in the study corresponded to the four female participants.
Nevertheless, if you have a desk job, like I do, you may want to stand up and pace for a few seconds every 30 minutes. You may also want to stand up while you talk on the phone. You may want to shift position from time to time; e.g., sitting at the edge of the chair for a few minutes every hour, without back support. And so on. These actions may take you a bit closer to the lifestyle of our Paleolithic ancestors, who were not sitting down motionless the whole day. Try also eating more like they did and, over a year, the results may be dramatic!
Reference:
James A. Levine, Norman L. Eberhardt, Michael D. Jensen (1999). Role of nonexercise activity thermogenesis in resistance to fat gain in humans. Science, 283(5399), 212-214.
Saturday, August 7, 2010
Cortisol, surprise-enhanced cognition, and flashbulb memories: Scaring people with a snake screen and getting a PhD for it!
Cortisol is a hormone that has a number of important functions. It gets us out of bed in the morning, it cranks up our metabolism in preparation for intense exercise, and it also helps us memorize things and even learn. Yes, it helps us learn. Memorization in particular, and cognition in general, would be significantly impaired without cortisol. When you are surprised, particularly with something unpleasant, cortisol levels increase and enhance cognition. This is in part what an interesting study suggests; a study in which I was involved. The study was properly “sanctified” by the academic peer-review process (Kock et al., 2009; full reference and link at the end of this post).
The main hypothesis tested through this study is also known as the “flashbulb memorization” hypothesis. Interestingly, up until this study was conducted no one seemed to have used evolution to provide a basis on which flashbulb memorization can be explained. The basic idea here is that enhanced cognition within the temporal vicinity of animal attacks (i.e., a few minutes before and after) allowed our hominid ancestors to better build and associate memories related to the animals and their typical habitat markers (e.g., vegetation, terrain, rock formations), which in turn increased their survival chances. Their survival chances increased because the memories helped them avoid a second encounter; if they survived the first, of course. And so flashbulb memorization evolved. (In fact, it might have evolved earlier than at the hominid stage, and it may also have evolved in other species.)
The study involved 186 student participants. The participants were asked to review web-based learning modules and subsequently take a test on what they had learned. Data from 6 learning modules in 2 experimental conditions were contrasted. In the treatment condition a web-based screen with a snake in attack position was used to surprise the participants; the snake screen was absent in the control condition. See schematic figure below (click on it to enlarge). The “surprise zone” in the figure comprises the modules immediately before and after the snake screen (modules 3 and 4); those are the modules in which higher scores were predicted.

The figure below (click on it to enlarge) shows a summary of the results. The top part of the figure shows the percentage differences between average scores obtained by participants in the treatment and control conditions. The bottom part of the figure shows the average scores obtained by participants in both conditions, as well as the scores that the participants would have obtained by chance. The chance scores would likely have been the ones obtained by the participants if their learning had been significantly impaired for any of the modules; this could have happened due to distraction, for example. As you can see, the scores for all modules are significantly higher than chance.

In summary, the participants who were surprised with the snake screen obtained significantly higher scores for the two modules immediately before (about 20 percent higher) and after (about 40 percent higher) the snake screen. The reason is that the surprise elicited by the snake screen increased cortisol levels, which in turn improved learning for modules 3 and 4. Adrenaline and noradrenaline (epinephrine and norepinephrine) may also be involved. This phenomenon is so odd that it seems to defy the laws of physics; note that Module 3 was reviewed before the snake screen. And, depending on the size of a test, this could have turned a “C” into an “A” grade!
Similarly, it is because of this action of cortisol that Americans reading this post, especially those who lived in the East Coast in 2001, remember vividly where they were, what they were doing, and who they were with, when they first heard about the September 11, 2001 Attacks. I was living in Philadelphia at the time, and I remember those details very vividly, even though the Attacks happened almost 10 years ago. That is one of the fascinating things that cortisol does; it instantaneously turns short-term contextual memories temporally associated with a surprise event (i.e., a few minutes before and after the event) into vivid long-term memories.
This study was part of the PhD research project of one of my former doctoral students, and now Dr. Ruth Chatelain-Jardon. Her PhD was granted in May 2010. She expanded the study through data collection in two different countries, and a wide range of analyses. (It is not that easy to get a PhD!) Her research provides solid evidence that flashbulb memorization is a real phenomenon, and also that it is a human universal. Thanks are also due to Dr. Jesus Carmona, another former doctoral student of mine who worked on a different PhD research project, but who also helped a lot with this project.
Reference:
Kock, N., Chatelain-Jardón, R., & Carmona, J. (2009). Scaring them into learning!? Using a snake screen to enhance the knowledge transfer effectiveness of a web interface. Decision Sciences Journal of Innovative Education, 7(2), 359-375.
Wednesday, August 4, 2010
The baffling rise in seasonal allergies: Global warming or obesity?
The July 26, 2010 issue of Fortune has an interesting set of graphs on page 14. It shows the rise of allergies in the USA, together with figures on lost productivity, doctor visits, and medical expenditures. (What would you expect? This is Fortune, and money matters.) It also shows some cool maps with allergen concentrations, and how they are likely to increase with global warming. (See below; click on it to enlarge; use the "CRTL" and "+" keys to zoom in, and CRTL" and "-" to zoom out.)

The implication: A rise in global temperatures is causing an increase in allergy cases. Supposedly the spring season starts earlier, with more pollen being produced overall, and thus more allergy cases.
Really!?
I checked their numbers against population growth, because as the population of a country increases, so will the absolute number of allergy cases (as well as cancer cases, and cases of almost any disease). What is important is whether there has been an increase in allergy rates, or the percentage of the population suffering from allergies. Well, indeed, allergy rates have been increasing.
Now, I don’t know about your neck of the woods, but temperatures have been unusually low this year in South Texas. Global warming may be happening, but given recent fluctuations in temperature, I am not sure global warming explains the increases in allergy rates. Particularly the spike in allergy rates in 2010; this seems to be very unlikely to be caused by global warming.
And I have my own experience of going from looking like a seal to looking more like a human being. When I was a seal (i.e., looked like one), I used to have horrible seasonal pollen allergies. Then I lost 60 lbs, and my allergies diminished dramatically. Why? Body fat secretes a number of pro-inflammatory hormones (see, e.g., this post, and also this one), and allergies are essentially exaggerated inflammatory responses.
So I added obesity rates to the mix, and came up with the table and graph below (click on it to enlarge).

Obesity rates and allergies do seem to go hand in hand, don’t you think? The correlation between obesity and allergy rates is a high 0.87!
Assuming that this correlation reflects reasonably well the relationship between obesity and allergy rates (something that is not entirely clear given the small sample), obesity would still explain only 75.7 percent of the variance in allergy rates (this number is the correlation squared). That is, about 24.3 percent of the variance in allergy rates would be due to other missing factors.
A strong candidate for missing factor is something that makes people obese in the first place, namely consumption of foods rich in refined grains, seeds, and sugars. Again, in my experience, removing these foods from my diet reduced the intensity of allergic reactions, but not as much as losing a significant amount of body fat. We are talking about things like cereals, white bread, doughnuts, pasta, pancakes covered with syrup, regular sodas, and fruit juices. Why? These foods also seem to increase serum concentrations of pro-inflammatory hormones within hours of their consumption.
Other candidates are vitamin D levels, and lack of exposure to natural environments during childhood, just to name a few. People seem to avoid the sun like the plague these days, which can lower their vitamin D levels. This is a problem because vitamin D modulates immune responses; so it is important in the spring, as well as in the winter. The lack of exposure to natural environments during childhood may make people more sensitive to natural allergens, like pollen.
Subscribe to:
Posts (Atom)
