
The study uses data from the Framingham Heart Study (FHS). The FHS, which started in the late 1940s, recruited 5209 healthy participants (2336 males and 2873 females), aged 28 to 62, in the town of Framingham, Massachusetts. At the time of Yashin and colleagues’ article publication, there were 993 surviving participants.
I rearranged figure 2 from the Yashin and colleagues article so that the two graphs (for females and males) appeared one beside the other. The result is shown below (click on it to enlarge); the caption at the bottom-right corner refers to both graphs. The figure shows the age-related trajectory of blood glucose levels, grouped by lifespan (LS), starting at age 40.

As you can see from the figure above, blood glucose levels increase with age, even for long-lived individuals (LS > 90). The increases follow a U-curve (a.k.a. J-curve) pattern; the beginning of the right side of a U curve, to be more precise. The main difference in the trajectories of the blood glucose levels is that as lifespan increases, so does the width of the U curve. In other words, in long-lived people, blood glucose increases slowly with age; particularly up to 55 years of age, when it starts increasing more rapidly.
Now, here is one of the rough edges of this study. The authors do not provide standard deviations. You can ignore the error bars around the points on the graph; they are not standard deviations. They are standard errors, which are much lower than the corresponding standard deviations. Standard errors are calculated by dividing the standard deviations by the square root of the sample sizes for each trajectory point (which the authors do not provide either), so they go up with age since progressively smaller numbers of individuals reach advanced ages.
So, no need to worry if your blood glucose levels are higher than those shown on the vertical axes of the graphs. (I will comment more on those numbers below.) Not everybody who lived beyond 90 had a blood glucose of around 80 mg/dl at age 40. I wouldn't be surprised if about 2/3 of the long-lived participants had blood glucose levels in the range of 65 to 95 at that age.
Here is another rough edge. It is pretty clear that the authors’ main independent variable (i.e., health predictor) in this study is average blood glucose, which they refer to simply as “blood glucose”. However, the measure of blood glucose in the FHS is a very rough estimation of average blood glucose, because they measured blood glucose levels at random times during the day. These measurements, when averaged, are closer to fasting blood glucose levels than to average blood glucose levels.
A more reliable measure of average blood glucose levels is that of glycated hemoglobin (HbA1c). Blood glucose glycates (i.e., sticks to, like most sugary substances) hemoglobin, a protein found in red blood cells. Since red blood cells are relatively long-lived, with a turnover of about 3 months, HbA1c (given in percentages) is a good indicator of average blood glucose levels (if you don’t suffer from anemia or a few other blood abnormalities). Based on HbA1c, one can then estimate his or her average blood glucose level for the previous 3 months before the test, using one of the following equations, depending on whether the measurement is in mg/dl or mmol/l.
Average blood glucose (mg/dl) = 28.7 × HbA1c − 46.7
Average blood glucose (mmol/l) = 1.59 × HbA1c − 2.59
The table below, from Wikipedia, shows average blood glucose levels corresponding to various HbA1c values. As you can see, they are generally higher than the corresponding fasting blood glucose levels would normally be (the latter is what the values on the vertical axes of the graphs above from Yashin and colleagues’ study roughly measure). This is to be expected, because blood glucose levels vary a lot during the day, and are often transitorily high in response to food intake and fluctuations in various hormones. Growth hormone, cortisol and noradrenaline are examples of hormones that increase blood glucose. Only one hormone effectively decreases blood glucose levels, insulin, by stimulating glucose uptake and storage as glycogen and fat.

Nevertheless, one can reasonably expect fasting blood glucose levels to have been highly correlated with average blood glucose levels in the sample. So, in my opinion, the graphs above showing age-related blood glucose trajectories are still valid, in terms of their overall shape, but the values on the vertical axes should have been measured differently, perhaps using the formulas above.
Ironically, those who achieve low average blood glucose levels (measured based on HbA1c) by adopting a low carbohydrate diet (one of the most effective ways) frequently have somewhat high fasting blood glucose levels because of physiological (or benign) insulin resistance. Their body is primed to burn fat for energy, not glucose. Thus when growth hormone levels spike in the morning, so do blood glucose levels, as muscle cells are in glucose rejection mode. This is a benign version of the dawn effect (a.k.a. dawn phenomenon), which happens with quite a few low carbohydrate dieters, particularly with those who are deep in ketosis at dawn.
Yashin and colleagues also modeled relative risk of death based on blood glucose levels, using a fairly sophisticated mathematical model that takes into consideration U-curve relationships. What they found is intuitively appealing, and is illustrated by the two graphs at the bottom of the figure below. The graphs show how the relative risks (e.g., 1.05, on the topmost dashed line on the both graphs) associated with various ranges of blood glucose levels vary with age, for both females and males.
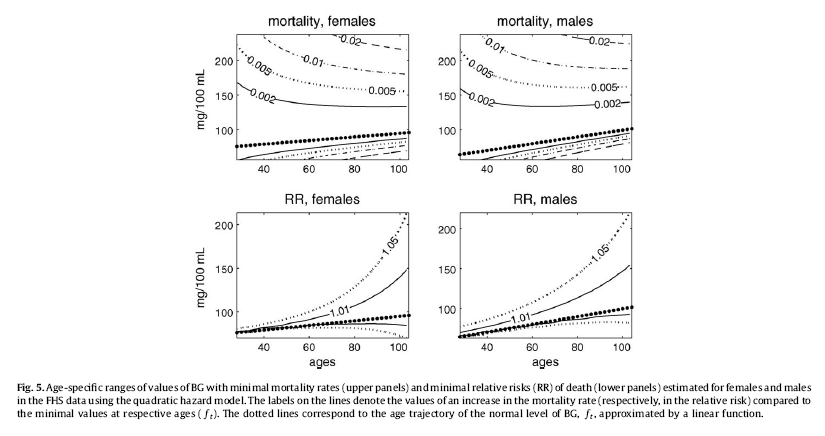
What the graphs above are telling us is that once you reach old age, controlling for blood sugar levels is not as effective as doing it earlier, because you are more likely to die from what the authors refer to as “other causes”. For example, at the age of 90, having a blood glucose of 150 mg/dl (corrected for the measurement problem noted earlier, this would be perhaps 165 mg/dl, from HbA1c values) is likely to increase your risk of death by only 5 percent. The graphs account for the facts that: (a) blood glucose levels naturally increase with age, and (b) fewer people survive as age progresses. So having that level of blood glucose at age 60 would significantly increase relative risk of death at that age; this is not shown on the graph, but can be inferred.
Here is a final rough edge of this study. From what I could gather from the underlying equations, the relative risks shown above do not account for the effect of high blood glucose levels earlier in life on relative risk of death later in life. This is a problem, even though it does not completely invalidate the conclusion above. As noted by several people (including Gary Taubes in his book Good Calories, Bad Calories), many of the diseases associated with high blood sugar levels (e.g., cancer) often take as much as 20 years of high blood sugar levels to develop. So the relative risks shown above underestimate the effect of high blood glucose levels earlier in life.
Do the long-lived participants have some natural protection against accelerated increases in blood sugar levels, or was it their diet and lifestyle that protected them? This question cannot be answered based on the study.
Assuming that their diet and lifestyle protected them, it is reasonable to argue that: (a) if you start controlling your average blood sugar levels well before you reach the age of 55, you may significantly increase your chances of living beyond the age of 90; (b) it is likely that your blood glucose levels will go up with age, but if you can manage to slow down that progression, you will increase your chances of living a longer and healthier life; (c) you should focus your control on reliable measures of average blood glucose levels, such as HbA1c, not fasting blood glucose levels (postprandial glucose levels are also a good option, because they contribute a lot to HbA1c increases); and (d) it is never too late to start controlling your blood glucose levels, but the more you wait, the bigger is the risk.
References:
Taubes, G. (2007). Good calories, bad calories: Challenging the conventional wisdom on diet, weight control, and disease. New York, NY: Alfred A. Knopf.
Yashin, A.I., Ukraintseva, S.V., Arbeev, K.G., Akushevich, I., Arbeeva, L.S., & Kulminski, A.M. (2009). Maintaining physiological state for exceptional survival: What is the normal level of blood glucose and does it change with age? Mechanisms of Ageing and Development, 130(9), 611-618.
