Popular beliefs about medical issues are sometimes motivated by a statistical phenomenon known as “spurious relationship”, among other names. Two variables X and Y are influenced by a third variable C, which leads to X and Y being correlated and thus the impression that X and Y are causally associated.
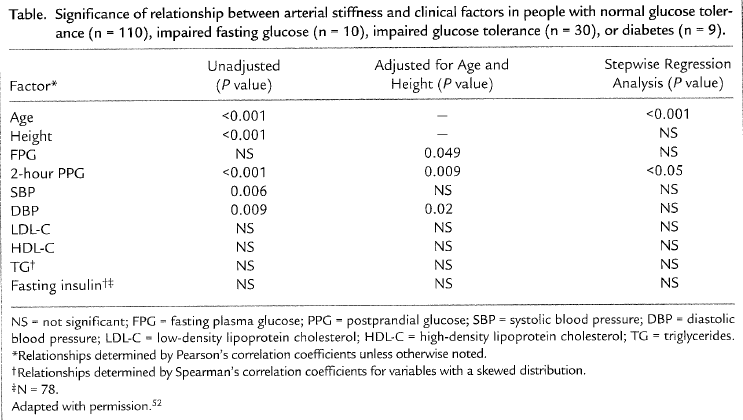
Take a look at the table below, which I blogged about in a previous post (). This table shows that there is a strong unadjusted correlation between height and arterial stiffness, a marker of heart disease. The likelihood that the correlation is due to chance is lower than one tenth of a percentage point (P<.001).
0>
Interestingly, the authors of the study even use height as a control variable to narrow down the “true” causes of arterial stiffness (column with adjusted results), assuming that height did indeed influence arterial stiffness and what they found to be a key predictor of arterial stiffness, 2-hour postprandial glucose.
But there is no convincing evidence that height causes heart disease, with exception of pathological extremes – e.g., acromegaly. Extremes tend to influence statistical results somewhat, leading to conflicting conclusions that end up being disseminated by the popular media (). This is one of the sources of popular beliefs about medical issues.
Another, more important, source are real confounders. And this takes us back to the issue of height being associated with heart disease. In fact, height will typically be significantly associated with heart disease in almost any study that includes men and women and does not control for biological sex.
One of the reasons is that women overall tend to have a significantly lower incident of heart disease than men. The other is that height is significantly lower among women than men, on average, even though there are several women who are taller than the average man.
The table above was from a study including both sexes. Therefore, the strong association between height and arterial stiffness is a “reflection” of the strong association between being male and increased arterial stiffness. If one were to add a variable coded as 0 for male and 1 for female, and use it in a multivariate analysis of predictor of arterial stiffness, together with height, the effect of height would probably “disappear”.
Biological sex is the control variable, the “confounder”, that the authors should have used to narrow down the “true” causes of arterial stiffness (second column in the table). In the absence of biological sex, controlling for height accomplished something similar, but in a “wobbly” way, leaving many readers scratching their heads in confusion.
Showing posts with label arterial stiffness. Show all posts
Monday, December 10, 2012
Monday, May 30, 2011
Interview with Jimmy Moore, and basics of intima-media thickness and plaque tests
Let me start this post by telling you that my interview with Jimmy Moore is coming up in about a week. Jimmy and I talk about evolution, statistics, and health – the main themes of this blog. We talk also about other things, and probably do not agree on everything. The interview was actually done a while ago, so I don’t remember exactly what we discussed.
From what I remember from mine and other interviews (I listen to Jimmy's podcasts regularly), I think I am the guest who has mentioned the most people during an interview – Gary Taubes, Chris Masterjohn, Carbsane, Petro (a.k.a., Peter “the Hyperlipid”), T. Colin Campbell, Denise Minger, Kurt Harris, Stephan Guyenet, Art De Vany, and a few others. What was I thinking?
In case you listen and wonder, my accent is a mix of Brazilian Portuguese, New Zealand English (where I am called “Need”), American English, and the dialect spoken in the “country” of Texas. The strongest influences are probably American English and Brazilian Portuguese.
Anyway, when medical doctors (MDs) look at someone’s lipid panel, one single number tends to draw their attention: the LDL cholesterol. That is essentially the amount of cholesterol in LDL particles.
One’s LDL cholesterol is a reflection of many factors, including: diet, amount of cholesterol produced by the liver, amount of cholesterol actually used by your body, amount of cholesterol recycled by the liver, and level of systemic inflammation. This number is usually calculated, and often very different from the number you get through a VAP test.
It is not uncommon for a high saturated fat diet to lead to a benign increase in LDL cholesterol. In this case the LDL particles will be large, which will also be reflected in a low “fasting triglycerides number” (lower than 70 mg/dl). While I say "benign" here, which implies a neutral effect on health, an increase in LDL cholesterol in this context may actually be health promoting.
Large LDL particles are less likely to cross the gaps in the endothelium, the thin layer of cells that lines the interior surface of blood vessels, and form atheromatous plaques.
Still, when an MD sees an LDL cholesterol higher than 100 mg/dl, more often than not he or she will tell you that it is bad news. Whether that is bad news or not is really speculation, even for high LDL numbers. A more reliable approach is to check one’s arteries directly. Interestingly, atheromatous plaques only form in arteries, not in veins.
The figure below (from: Novogen.com) shows a photomicrograph of carotid arteries from rabbits, which are very similar, qualitatively speaking, to those of humans. The meanings of the letters are: L = lumen; I = intima; M = media; and A = adventitia. The one on the right has significantly lower intima-media (I-M) thickness than the one on the left.
Atherosclerosis in humans tends to lead to an increase in I-M thickness; the I-M area being normally where atheromatous plaques grow. Aging also leads to an increase in I-M thickness. Typically one’s risk of premature death from cardiovascular complications correlates with one’s I-M thickness’ “distance” from that of low-risk individuals in the same sex and age group.
This notion has led to the coining of the term “vascular age”. For example, someone may be 30 years old, but have a vascular age of 80, meaning that his or her I-M thickness is that of an average 80-year-old. Conversely, someone may be 80 and have a vascular age of 30.
Nearly everybody’s I-M thickness goes up with age, even people who live to be 100 or more. Incidentally, this is true for average blood glucose levels as well. In long-living people they both go up slowly.
I-M thickness tests are noninvasive, based on external ultrasound, and often covered by health insurance. They take only a few minutes to conduct. Their reports provide information about one’s I-M thickness and its relative position in the same sex and age group, as well as the amount of deposited plaque. The latter is frequently provided as a bonus, since it can also be inferred with reasonable precision from the computer images generated via ultrasound.
Below is the top part of a typical I-M thickness test report (from: Sonosite.com). It shows a person’s average (or mean) I-M thickness; the red dot on the graph. The letter notations (A … E) are for reference groups. For the majority of the folks doing this test, the most important on this report are the thick and thin lines indicated as E, which are based on Aminbakhsh and Mancini’s (1999) study.
The reason why the thick and thin lines indicated as E are the most important for the majority of folks taking this test is that they are based on a study that provides one of the best reference ranges for people who are 45 and older, who are usually the ones getting their I-M thickness tested. Roughly speaking, if your red dot is above the thin line, you are at increased risk of cardiovascular disease.
Most people will fall in between the thick and thin lines. Those below the thick line (with the little blue triangles) are at very low risk, especially if they have little to no plaque. The person for whom this test was made is at very low risk. His red dot is below the thick line, when that line is extended to the little triangle indicated as D.
Below is the bottom part of the I-M thickness test report. The max I-M thickness score shown here tends to add little in terms of diagnosis to the mean score shown earlier. Here the most important part is the summary, under “Comments”. It says that the person has no plaque, and is at a lower risk of heart attack. If you do an I-M thickness test, your doctor will probably be able to tell you more about these results.
I like numbers, so I had an I-M thickness test done recently on me. When the doctor saw the results, which we discussed, he told me that he could guarantee two things: (1) I would die; and (2) but not of heart disease. MDs have an interesting sense of humor; just hang out with a group of them during a “happy hour” and you’ll see.
My red dot was below the thick line, and I had a plaque measurement of zero. I am 47 years old, eat about 1 lb of meat per day, and around 20 eggs per week - with the yolk. About half of the meat I eat comes from animal organs (mostly liver) and seafood. I eat organ meats about once a week, and seafood three times a week. This is an enormous amount of dietary cholesterol, by American diet standards. My saturated fat intake is also high by the same standards.
You can check the post on my transformation to see what I have been doing for years now, and some of the results in terms of levels of energy, disease, and body fat levels. Keep in mind that mine are essentially the results of a single-individual experiment; results that clearly contradict the lipid hypothesis. Still, they are also consistent with a lot of fairly reliable empirical research.
From what I remember from mine and other interviews (I listen to Jimmy's podcasts regularly), I think I am the guest who has mentioned the most people during an interview – Gary Taubes, Chris Masterjohn, Carbsane, Petro (a.k.a., Peter “the Hyperlipid”), T. Colin Campbell, Denise Minger, Kurt Harris, Stephan Guyenet, Art De Vany, and a few others. What was I thinking?
In case you listen and wonder, my accent is a mix of Brazilian Portuguese, New Zealand English (where I am called “Need”), American English, and the dialect spoken in the “country” of Texas. The strongest influences are probably American English and Brazilian Portuguese.
Anyway, when medical doctors (MDs) look at someone’s lipid panel, one single number tends to draw their attention: the LDL cholesterol. That is essentially the amount of cholesterol in LDL particles.
One’s LDL cholesterol is a reflection of many factors, including: diet, amount of cholesterol produced by the liver, amount of cholesterol actually used by your body, amount of cholesterol recycled by the liver, and level of systemic inflammation. This number is usually calculated, and often very different from the number you get through a VAP test.
It is not uncommon for a high saturated fat diet to lead to a benign increase in LDL cholesterol. In this case the LDL particles will be large, which will also be reflected in a low “fasting triglycerides number” (lower than 70 mg/dl). While I say "benign" here, which implies a neutral effect on health, an increase in LDL cholesterol in this context may actually be health promoting.
Large LDL particles are less likely to cross the gaps in the endothelium, the thin layer of cells that lines the interior surface of blood vessels, and form atheromatous plaques.
Still, when an MD sees an LDL cholesterol higher than 100 mg/dl, more often than not he or she will tell you that it is bad news. Whether that is bad news or not is really speculation, even for high LDL numbers. A more reliable approach is to check one’s arteries directly. Interestingly, atheromatous plaques only form in arteries, not in veins.
The figure below (from: Novogen.com) shows a photomicrograph of carotid arteries from rabbits, which are very similar, qualitatively speaking, to those of humans. The meanings of the letters are: L = lumen; I = intima; M = media; and A = adventitia. The one on the right has significantly lower intima-media (I-M) thickness than the one on the left.
Atherosclerosis in humans tends to lead to an increase in I-M thickness; the I-M area being normally where atheromatous plaques grow. Aging also leads to an increase in I-M thickness. Typically one’s risk of premature death from cardiovascular complications correlates with one’s I-M thickness’ “distance” from that of low-risk individuals in the same sex and age group.
This notion has led to the coining of the term “vascular age”. For example, someone may be 30 years old, but have a vascular age of 80, meaning that his or her I-M thickness is that of an average 80-year-old. Conversely, someone may be 80 and have a vascular age of 30.
Nearly everybody’s I-M thickness goes up with age, even people who live to be 100 or more. Incidentally, this is true for average blood glucose levels as well. In long-living people they both go up slowly.
I-M thickness tests are noninvasive, based on external ultrasound, and often covered by health insurance. They take only a few minutes to conduct. Their reports provide information about one’s I-M thickness and its relative position in the same sex and age group, as well as the amount of deposited plaque. The latter is frequently provided as a bonus, since it can also be inferred with reasonable precision from the computer images generated via ultrasound.
Below is the top part of a typical I-M thickness test report (from: Sonosite.com). It shows a person’s average (or mean) I-M thickness; the red dot on the graph. The letter notations (A … E) are for reference groups. For the majority of the folks doing this test, the most important on this report are the thick and thin lines indicated as E, which are based on Aminbakhsh and Mancini’s (1999) study.
The reason why the thick and thin lines indicated as E are the most important for the majority of folks taking this test is that they are based on a study that provides one of the best reference ranges for people who are 45 and older, who are usually the ones getting their I-M thickness tested. Roughly speaking, if your red dot is above the thin line, you are at increased risk of cardiovascular disease.
Most people will fall in between the thick and thin lines. Those below the thick line (with the little blue triangles) are at very low risk, especially if they have little to no plaque. The person for whom this test was made is at very low risk. His red dot is below the thick line, when that line is extended to the little triangle indicated as D.
Below is the bottom part of the I-M thickness test report. The max I-M thickness score shown here tends to add little in terms of diagnosis to the mean score shown earlier. Here the most important part is the summary, under “Comments”. It says that the person has no plaque, and is at a lower risk of heart attack. If you do an I-M thickness test, your doctor will probably be able to tell you more about these results.
I like numbers, so I had an I-M thickness test done recently on me. When the doctor saw the results, which we discussed, he told me that he could guarantee two things: (1) I would die; and (2) but not of heart disease. MDs have an interesting sense of humor; just hang out with a group of them during a “happy hour” and you’ll see.
My red dot was below the thick line, and I had a plaque measurement of zero. I am 47 years old, eat about 1 lb of meat per day, and around 20 eggs per week - with the yolk. About half of the meat I eat comes from animal organs (mostly liver) and seafood. I eat organ meats about once a week, and seafood three times a week. This is an enormous amount of dietary cholesterol, by American diet standards. My saturated fat intake is also high by the same standards.
You can check the post on my transformation to see what I have been doing for years now, and some of the results in terms of levels of energy, disease, and body fat levels. Keep in mind that mine are essentially the results of a single-individual experiment; results that clearly contradict the lipid hypothesis. Still, they are also consistent with a lot of fairly reliable empirical research.
Thursday, May 27, 2010
Postprandial glucose levels, HbA1c, and arterial stiffness: Compared to glucose, lipids are not even on the radar screen
Postprandial glucose levels are the levels of blood glucose after meals. In Western urban environments, the main contributors to elevated postprandial glucose are foods rich in refined carbohydrates and sugars. While postprandial glucose levels may vary somewhat erratically, they are particularly elevated in the morning after breakfast. The main reason for this is that breakfast, in Western urban environments, is typically very high in refined carbohydrates and sugars.
HbA1c, or glycated hemoglobin, is a measure of average blood glucose over a period of a few months. Blood glucose glycates (i.e., sticks to) hemoglobin, a protein found in red blood cells. Red blood cells are relatively long-lived, lasting approximately 3 months. Thus HbA1c (given in percentages) is a good indicator of average blood glucose levels, if you don’t suffer from anemia or a few other blood abnormalities.
Based on HbA1c, one can then estimate his or her average blood glucose level for the previous 3 months or so before the test, using one of the following equations, depending on whether the measurement is in mg/dl or mmol/l.
Average blood glucose (mg/dl) = 28.7 × HbA1c − 46.7
Average blood glucose (mmol/l) = 1.59 × HbA1c − 2.59
Elevated blood glucose levels cause damage in the body primarily through glycation, which leads to the formation of advanced glycation endproducts (AGEs). Given this, HbA1c can be seen as a proxy for the level of damage done by elevated blood glucose levels to various body tissues. This damage occurs over time; often after many years of high blood glucose levels. It includes kidney damage, neurological damage, cardiovascular damage, and damage to the retina.
Most regular blood exams focus on fasting blood glucose as a measure of glucose metabolism status. Many medical practitioners have as a target a fasting blood glucose level of 125 mg/dl (7 mmol/l) or less, and largely disregard postprandial glucose levels or HbA1c in their management of glucose metabolism. Leiter and colleagues (2005; full reference at the end of this post) showed that this focus on fasting blood glucose is a mistake. They are not alone; many others made this point, including some very knowledgeable bloggers who focus on diabetes (see “Interesting links” section of this blog). Leiter and colleagues (2005) also provided some interesting graphs and figures, including eye-opening correlations between various variables and arterial stiffness. The figure below (click to enlarge) shows the contribution of postprandial glucose to HbA1c.
Note that the lower the HbA1c is in the figure (horizontal axis), the higher is the postprandial glucose contribution to HbA1c. And, the lower the HbA1c, the closer the individuals are to what one could consider having a perfectly normal HbA1c level (around 5 percent). That is, only for individuals whose HbA1c levels are very high, fasting blood glucose levels are relatively reliable measures of the tissue damage done be elevated blood glucose levels.
The table below (click to enlarge) shows P values associated with the impact of various variables (listed on the leftmost column) on arterial stiffness. This measure, arterial stiffness, is strongly associated with an increased risk of cardiovascular events. Look at the middle column showing P values adjusted for age and height. The lower the P value, the more a variable affects arterial stiffness. The variable with the lowest P value by far is 2-hour postprandial blood glucose; the blood glucose levels measured 2 hours after meals.
Fasting glucose levels were reported to be statistically insignificant because of the P = 0.049, in terms of their effect on arterial stiffness, but this P value is actually significant, although barely, at the 0.05 level (95 percent confidence). Interestingly, the following measures are not even on the radar screen, as far as arterial stiffness is concerned: systolic blood pressure, LDL cholesterol, HDL cholesterol, triglycerides, and fasting insulin levels.
What about the lipid hypothesis, and the “bad” LDL cholesterol!? This study is telling us that these are not very relevant for arterial stiffness when we control for the effect of blood glucose measures. Not even fasting insulin levels matters much! Wait, not even HDL!!! A high HDL has been definitely shown to be protective, but when we look at the relative magnitude of various effects, the story is a bit different. A high HDL’s protective effect exists, but it is dwarfed by the negative effect of high blood glucose levels, especially after meals, in the context of cardiovascular disease.
What all this points at is what we could call a postprandial glucose hypothesis: Lower your postprandial glucose levels, and live a longer, healthier life! And, by the way, if your postprandial glucose levels are under control, lipids do not matter much! Or maybe your lipids will fall into place, without any need for statin drugs, after your postprandial glucose levels are under control. One way or another, the outcome will be a positive one. That is what the data from this study is telling us.
How do you lower your postprandial glucose levels?
A good way to start is to remove foods rich in refined carbohydrates and sugars from your diet. Almost all of these are foods engineered by humans with the goal of being addictive; they usually come in boxes and brightly colored plastic wraps. They are not hard to miss. They are typically in the central aisles of supermarkets. The sooner you remove them from your diet, the better. The more completely you do this, the better.
Note that the evidence discussed in this post is in connection with blood glucose levels, not glucose metabolism per se. If you have impaired glucose metabolism (e.g., diabetes type 2), you can still avoid a lot of problems if you effectively control your blood glucose levels. You may have to be a bit more aggressive, adding low carbohydrate dieting (as in the Atkins or Optimal diets) to the removal of refined carbohydrates and sugars from your diet; the latter is in many ways similar to adopting a Paleolithic diet. You may have to take some drugs, such as Metformin (a.k.a. Glucophage). But you are certainly not doomed if you are diabetic.
Reference:
Leiter, L.A., Ceriello, A., Davidson, J.A., Hanefeld, M., Monnier, L., Owens, D.R., Tajima, N., & Tuomilehto, J. (2005). Postprandial glucose regulation: New data and new implications. Clinical Therapeutics, 27(2), S42-S56.
HbA1c, or glycated hemoglobin, is a measure of average blood glucose over a period of a few months. Blood glucose glycates (i.e., sticks to) hemoglobin, a protein found in red blood cells. Red blood cells are relatively long-lived, lasting approximately 3 months. Thus HbA1c (given in percentages) is a good indicator of average blood glucose levels, if you don’t suffer from anemia or a few other blood abnormalities.
Based on HbA1c, one can then estimate his or her average blood glucose level for the previous 3 months or so before the test, using one of the following equations, depending on whether the measurement is in mg/dl or mmol/l.
Average blood glucose (mg/dl) = 28.7 × HbA1c − 46.7
Average blood glucose (mmol/l) = 1.59 × HbA1c − 2.59
Elevated blood glucose levels cause damage in the body primarily through glycation, which leads to the formation of advanced glycation endproducts (AGEs). Given this, HbA1c can be seen as a proxy for the level of damage done by elevated blood glucose levels to various body tissues. This damage occurs over time; often after many years of high blood glucose levels. It includes kidney damage, neurological damage, cardiovascular damage, and damage to the retina.
Most regular blood exams focus on fasting blood glucose as a measure of glucose metabolism status. Many medical practitioners have as a target a fasting blood glucose level of 125 mg/dl (7 mmol/l) or less, and largely disregard postprandial glucose levels or HbA1c in their management of glucose metabolism. Leiter and colleagues (2005; full reference at the end of this post) showed that this focus on fasting blood glucose is a mistake. They are not alone; many others made this point, including some very knowledgeable bloggers who focus on diabetes (see “Interesting links” section of this blog). Leiter and colleagues (2005) also provided some interesting graphs and figures, including eye-opening correlations between various variables and arterial stiffness. The figure below (click to enlarge) shows the contribution of postprandial glucose to HbA1c.
Note that the lower the HbA1c is in the figure (horizontal axis), the higher is the postprandial glucose contribution to HbA1c. And, the lower the HbA1c, the closer the individuals are to what one could consider having a perfectly normal HbA1c level (around 5 percent). That is, only for individuals whose HbA1c levels are very high, fasting blood glucose levels are relatively reliable measures of the tissue damage done be elevated blood glucose levels.
The table below (click to enlarge) shows P values associated with the impact of various variables (listed on the leftmost column) on arterial stiffness. This measure, arterial stiffness, is strongly associated with an increased risk of cardiovascular events. Look at the middle column showing P values adjusted for age and height. The lower the P value, the more a variable affects arterial stiffness. The variable with the lowest P value by far is 2-hour postprandial blood glucose; the blood glucose levels measured 2 hours after meals.
Fasting glucose levels were reported to be statistically insignificant because of the P = 0.049, in terms of their effect on arterial stiffness, but this P value is actually significant, although barely, at the 0.05 level (95 percent confidence). Interestingly, the following measures are not even on the radar screen, as far as arterial stiffness is concerned: systolic blood pressure, LDL cholesterol, HDL cholesterol, triglycerides, and fasting insulin levels.
What about the lipid hypothesis, and the “bad” LDL cholesterol!? This study is telling us that these are not very relevant for arterial stiffness when we control for the effect of blood glucose measures. Not even fasting insulin levels matters much! Wait, not even HDL!!! A high HDL has been definitely shown to be protective, but when we look at the relative magnitude of various effects, the story is a bit different. A high HDL’s protective effect exists, but it is dwarfed by the negative effect of high blood glucose levels, especially after meals, in the context of cardiovascular disease.
What all this points at is what we could call a postprandial glucose hypothesis: Lower your postprandial glucose levels, and live a longer, healthier life! And, by the way, if your postprandial glucose levels are under control, lipids do not matter much! Or maybe your lipids will fall into place, without any need for statin drugs, after your postprandial glucose levels are under control. One way or another, the outcome will be a positive one. That is what the data from this study is telling us.
How do you lower your postprandial glucose levels?
A good way to start is to remove foods rich in refined carbohydrates and sugars from your diet. Almost all of these are foods engineered by humans with the goal of being addictive; they usually come in boxes and brightly colored plastic wraps. They are not hard to miss. They are typically in the central aisles of supermarkets. The sooner you remove them from your diet, the better. The more completely you do this, the better.
Note that the evidence discussed in this post is in connection with blood glucose levels, not glucose metabolism per se. If you have impaired glucose metabolism (e.g., diabetes type 2), you can still avoid a lot of problems if you effectively control your blood glucose levels. You may have to be a bit more aggressive, adding low carbohydrate dieting (as in the Atkins or Optimal diets) to the removal of refined carbohydrates and sugars from your diet; the latter is in many ways similar to adopting a Paleolithic diet. You may have to take some drugs, such as Metformin (a.k.a. Glucophage). But you are certainly not doomed if you are diabetic.
Reference:
Leiter, L.A., Ceriello, A., Davidson, J.A., Hanefeld, M., Monnier, L., Owens, D.R., Tajima, N., & Tuomilehto, J. (2005). Postprandial glucose regulation: New data and new implications. Clinical Therapeutics, 27(2), S42-S56.
Labels:
arterial stiffness,
cardiovascular disease,
cholesterol,
diabetes,
glucose,
HbA1c,
HDL,
LDL,
lipids,
research
Subscribe to:
Posts (Atom)