This post refers to an interesting study by Yashin and colleagues (2009) at Duke University’s Center for Population Health and Aging. (The full reference to the article, and a link, are at the end of this post.) This study is a gem with some rough edges, and some interesting implications.
The study uses data from the Framingham Heart Study (FHS). The FHS, which started in the late 1940s, recruited 5209 healthy participants (2336 males and 2873 females), aged 28 to 62, in the town of Framingham, Massachusetts. At the time of Yashin and colleagues’ article publication, there were 993 surviving participants.
I rearranged figure 2 from the Yashin and colleagues article so that the two graphs (for females and males) appeared one beside the other. The result is shown below (click on it to enlarge); the caption at the bottom-right corner refers to both graphs. The figure shows the age-related trajectory of blood glucose levels, grouped by lifespan (LS), starting at age 40.
As you can see from the figure above, blood glucose levels increase with age, even for long-lived individuals (LS > 90). The increases follow a U-curve (a.k.a. J-curve) pattern; the beginning of the right side of a U curve, to be more precise. The main difference in the trajectories of the blood glucose levels is that as lifespan increases, so does the width of the U curve. In other words, in long-lived people, blood glucose increases slowly with age; particularly up to 55 years of age, when it starts increasing more rapidly.
Now, here is one of the rough edges of this study. The authors do not provide standard deviations. You can ignore the error bars around the points on the graph; they are not standard deviations. They are standard errors, which are much lower than the corresponding standard deviations. Standard errors are calculated by dividing the standard deviations by the square root of the sample sizes for each trajectory point (which the authors do not provide either), so they go up with age since progressively smaller numbers of individuals reach advanced ages.
So, no need to worry if your blood glucose levels are higher than those shown on the vertical axes of the graphs. (I will comment more on those numbers below.) Not everybody who lived beyond 90 had a blood glucose of around 80 mg/dl at age 40. I wouldn't be surprised if about 2/3 of the long-lived participants had blood glucose levels in the range of 65 to 95 at that age.
Here is another rough edge. It is pretty clear that the authors’ main independent variable (i.e., health predictor) in this study is average blood glucose, which they refer to simply as “blood glucose”. However, the measure of blood glucose in the FHS is a very rough estimation of average blood glucose, because they measured blood glucose levels at random times during the day. These measurements, when averaged, are closer to fasting blood glucose levels than to average blood glucose levels.
A more reliable measure of average blood glucose levels is that of glycated hemoglobin (HbA1c). Blood glucose glycates (i.e., sticks to, like most sugary substances) hemoglobin, a protein found in red blood cells. Since red blood cells are relatively long-lived, with a turnover of about 3 months, HbA1c (given in percentages) is a good indicator of average blood glucose levels (if you don’t suffer from anemia or a few other blood abnormalities). Based on HbA1c, one can then estimate his or her average blood glucose level for the previous 3 months before the test, using one of the following equations, depending on whether the measurement is in mg/dl or mmol/l.
Average blood glucose (mg/dl) = 28.7 × HbA1c − 46.7
Average blood glucose (mmol/l) = 1.59 × HbA1c − 2.59
The table below, from Wikipedia, shows average blood glucose levels corresponding to various HbA1c values. As you can see, they are generally higher than the corresponding fasting blood glucose levels would normally be (the latter is what the values on the vertical axes of the graphs above from Yashin and colleagues’ study roughly measure). This is to be expected, because blood glucose levels vary a lot during the day, and are often transitorily high in response to food intake and fluctuations in various hormones. Growth hormone, cortisol and noradrenaline are examples of hormones that increase blood glucose. Only one hormone effectively decreases blood glucose levels, insulin, by stimulating glucose uptake and storage as glycogen and fat.
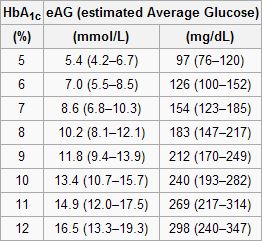
Nevertheless, one can reasonably expect fasting blood glucose levels to have been highly correlated with average blood glucose levels in the sample. So, in my opinion, the graphs above showing age-related blood glucose trajectories are still valid, in terms of their overall shape, but the values on the vertical axes should have been measured differently, perhaps using the formulas above.
Ironically, those who achieve low average blood glucose levels (measured based on HbA1c) by adopting a low carbohydrate diet (one of the most effective ways) frequently have somewhat high fasting blood glucose levels because of physiological (or benign) insulin resistance. Their body is primed to burn fat for energy, not glucose. Thus when growth hormone levels spike in the morning, so do blood glucose levels, as muscle cells are in glucose rejection mode. This is a benign version of the dawn effect (a.k.a. dawn phenomenon), which happens with quite a few low carbohydrate dieters, particularly with those who are deep in ketosis at dawn.
Yashin and colleagues also modeled relative risk of death based on blood glucose levels, using a fairly sophisticated mathematical model that takes into consideration U-curve relationships. What they found is intuitively appealing, and is illustrated by the two graphs at the bottom of the figure below. The graphs show how the relative risks (e.g., 1.05, on the topmost dashed line on the both graphs) associated with various ranges of blood glucose levels vary with age, for both females and males.
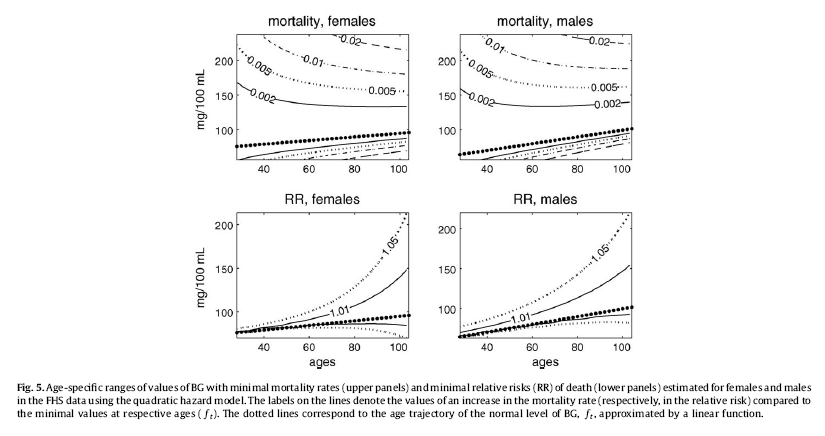
What the graphs above are telling us is that once you reach old age, controlling for blood sugar levels is not as effective as doing it earlier, because you are more likely to die from what the authors refer to as “other causes”. For example, at the age of 90, having a blood glucose of 150 mg/dl (corrected for the measurement problem noted earlier, this would be perhaps 165 mg/dl, from HbA1c values) is likely to increase your risk of death by only 5 percent. The graphs account for the facts that: (a) blood glucose levels naturally increase with age, and (b) fewer people survive as age progresses. So having that level of blood glucose at age 60 would significantly increase relative risk of death at that age; this is not shown on the graph, but can be inferred.
Here is a final rough edge of this study. From what I could gather from the underlying equations, the relative risks shown above do not account for the effect of high blood glucose levels earlier in life on relative risk of death later in life. This is a problem, even though it does not completely invalidate the conclusion above. As noted by several people (including Gary Taubes in his book Good Calories, Bad Calories), many of the diseases associated with high blood sugar levels (e.g., cancer) often take as much as 20 years of high blood sugar levels to develop. So the relative risks shown above underestimate the effect of high blood glucose levels earlier in life.
Do the long-lived participants have some natural protection against accelerated increases in blood sugar levels, or was it their diet and lifestyle that protected them? This question cannot be answered based on the study.
Assuming that their diet and lifestyle protected them, it is reasonable to argue that: (a) if you start controlling your average blood sugar levels well before you reach the age of 55, you may significantly increase your chances of living beyond the age of 90; (b) it is likely that your blood glucose levels will go up with age, but if you can manage to slow down that progression, you will increase your chances of living a longer and healthier life; (c) you should focus your control on reliable measures of average blood glucose levels, such as HbA1c, not fasting blood glucose levels (postprandial glucose levels are also a good option, because they contribute a lot to HbA1c increases); and (d) it is never too late to start controlling your blood glucose levels, but the more you wait, the bigger is the risk.
References:
Taubes, G. (2007). Good calories, bad calories: Challenging the conventional wisdom on diet, weight control, and disease. New York, NY: Alfred A. Knopf.
Yashin, A.I., Ukraintseva, S.V., Arbeev, K.G., Akushevich, I., Arbeeva, L.S., & Kulminski, A.M. (2009). Maintaining physiological state for exceptional survival: What is the normal level of blood glucose and does it change with age? Mechanisms of Ageing and Development, 130(9), 611-618.
Showing posts with label glycation. Show all posts
Tuesday, June 22, 2021
Monday, January 30, 2017
Blood glucose variations in normal individuals: A chaotic mess
I love statistics. But statistics is the science that will tell you that each person in a group of 20 people ate half a chicken per week over six months, until you realize that 10 died because they ate nothing while the other 10 ate a full chicken every week.
Statistics is the science that will tell you that there is an “association” between these two variables: my weight from 1 to 20 years of age, and the price of gasoline during that period. These two variables are indeed highly correlated, by neither has influenced the other in any way.
This is why I often like to see the underlying numbers when I am told that such and such health measure on average is this or that, or that this or that disease is associated with elevated consumption of whatever. Statistical results must be interpreted carefully. Lying with statistics is very easy.
A case in point is that of blood glucose variations among normal individuals. Try plotting them on graphs. What do you see? A chaotic mess, even when the individuals are pre-screened to exclude anybody with blood glucose abnormalities that would even hint at pre-diabetes. You see wild fluctuations that, while not going up to levels like 200 mg/dl, are much less predictable than many people are told they should be.
Blood glucose levels are influenced by so many factors (Elliott & Elliott, 2009) that I would be surprised if they were as smooth as those in graphs that are frequently used to show how blood glucose is supposed to vary in healthy individuals. Often we see a flat line up until the time of a meal, when the line curves up rapidly and then goes down quickly. It usually peaks at around 140 mg/dl, dropping well below 120 mg/dl after 2 hours.
Those smooth graphs are usually obtained through algorithms that have statistical methods at their core. The algorithms are designed to generate a smooth representations of scattered or disorganized data points. A little bit like the algorithms in software tools that plot best-fit regression curves passing through scattered points (e.g., warppls.com).
The picture below (click on it to enlarge) is from a 2006 symposium presentation by Prof. J.S. Christiansen, who is a widely cited diabetes researcher. The whole presentation is available from: www.diabetes-symposium.org. It shows the blood glucose variations of 21 young and normal individuals, based on data collected over a period of 2 days. Each individual is represented by a different color. The points on each curve are actually averages of two blood glucose measurements; the original measurements themselves vary even more chaotically.
As you can see from the picture above, each individual has a unique set of responses to main meals, which are represented by the three main blood glucose peaks. Overall, blood glucose levels vary from about 50 to 170 mg/dl, and in several cases remain above 120 mg/dl after 2 hours since a large meal. They vary somewhat chaotically during the night as well, often getting up to around 110 mg/dl.
And these are only 21 individuals, not 100 or 1000. Again, these individuals were all normal (i.e., normoglycemic, in medical research parlance), with an average glycated hemoglobin (HbA1c) of 5 percent, and a range of variation of HbA1c of 4.3 to 5.4 percent.
We can safely assume that these individuals were not on a low carbohydrate diet. The spikes in blood glucose after meals suggest that they were eating foods loaded with refined carbohydrates and/or sugars, particularly for breakfast. So, we can also safely assume that they were somewhat "desensitized" (in terms of glucose response) to those types of foods. Someone who had been on a low carbohydrate diet for a while, and who would thus be more sensitive, would have had even wilder blood glucose variations in response to the same meals.
Many people measure their glucose levels throughout the day with portable glucometers, and quite a few are likely to self-diagnose as pre-diabetics when they see something that they think is a “red flag”. Examples are a blood glucose level peaking at 165 mg/dl, or remaining above 120 mg/dl after 2 hours passed since a meal. Another example is a level of 110 mg/dl when they wake up very early to go to work, after several hours of fasting.
As you can see from the picture above, these “red flag” events do occur in young normoglycemic individuals.
If seeing “red flags” helps people remove refined carbohydrates and sugars from their diet, then fine.
But it may also cause them unnecessary chronic stress, and stress can kill.
Reference:
Elliott, W.H., & Elliott, D.C. (2009). Biochemistry and molecular biology. 4th Edition. New York: NY: Oxford University Press.
Statistics is the science that will tell you that there is an “association” between these two variables: my weight from 1 to 20 years of age, and the price of gasoline during that period. These two variables are indeed highly correlated, by neither has influenced the other in any way.
This is why I often like to see the underlying numbers when I am told that such and such health measure on average is this or that, or that this or that disease is associated with elevated consumption of whatever. Statistical results must be interpreted carefully. Lying with statistics is very easy.
A case in point is that of blood glucose variations among normal individuals. Try plotting them on graphs. What do you see? A chaotic mess, even when the individuals are pre-screened to exclude anybody with blood glucose abnormalities that would even hint at pre-diabetes. You see wild fluctuations that, while not going up to levels like 200 mg/dl, are much less predictable than many people are told they should be.
Blood glucose levels are influenced by so many factors (Elliott & Elliott, 2009) that I would be surprised if they were as smooth as those in graphs that are frequently used to show how blood glucose is supposed to vary in healthy individuals. Often we see a flat line up until the time of a meal, when the line curves up rapidly and then goes down quickly. It usually peaks at around 140 mg/dl, dropping well below 120 mg/dl after 2 hours.
Those smooth graphs are usually obtained through algorithms that have statistical methods at their core. The algorithms are designed to generate a smooth representations of scattered or disorganized data points. A little bit like the algorithms in software tools that plot best-fit regression curves passing through scattered points (e.g., warppls.com).
The picture below (click on it to enlarge) is from a 2006 symposium presentation by Prof. J.S. Christiansen, who is a widely cited diabetes researcher. The whole presentation is available from: www.diabetes-symposium.org. It shows the blood glucose variations of 21 young and normal individuals, based on data collected over a period of 2 days. Each individual is represented by a different color. The points on each curve are actually averages of two blood glucose measurements; the original measurements themselves vary even more chaotically.
As you can see from the picture above, each individual has a unique set of responses to main meals, which are represented by the three main blood glucose peaks. Overall, blood glucose levels vary from about 50 to 170 mg/dl, and in several cases remain above 120 mg/dl after 2 hours since a large meal. They vary somewhat chaotically during the night as well, often getting up to around 110 mg/dl.
And these are only 21 individuals, not 100 or 1000. Again, these individuals were all normal (i.e., normoglycemic, in medical research parlance), with an average glycated hemoglobin (HbA1c) of 5 percent, and a range of variation of HbA1c of 4.3 to 5.4 percent.
We can safely assume that these individuals were not on a low carbohydrate diet. The spikes in blood glucose after meals suggest that they were eating foods loaded with refined carbohydrates and/or sugars, particularly for breakfast. So, we can also safely assume that they were somewhat "desensitized" (in terms of glucose response) to those types of foods. Someone who had been on a low carbohydrate diet for a while, and who would thus be more sensitive, would have had even wilder blood glucose variations in response to the same meals.
Many people measure their glucose levels throughout the day with portable glucometers, and quite a few are likely to self-diagnose as pre-diabetics when they see something that they think is a “red flag”. Examples are a blood glucose level peaking at 165 mg/dl, or remaining above 120 mg/dl after 2 hours passed since a meal. Another example is a level of 110 mg/dl when they wake up very early to go to work, after several hours of fasting.
As you can see from the picture above, these “red flag” events do occur in young normoglycemic individuals.
If seeing “red flags” helps people remove refined carbohydrates and sugars from their diet, then fine.
But it may also cause them unnecessary chronic stress, and stress can kill.
Reference:
Elliott, W.H., & Elliott, D.C. (2009). Biochemistry and molecular biology. 4th Edition. New York: NY: Oxford University Press.
Monday, October 17, 2011
Book review: Perfect Health Diet
Perfect Health Diet is a book that one should own. It is not the type of book that you can get from your local library and just do a quick read over (and, maybe, write a review about it). If you do that, you will probably miss several important ideas that form the foundation of this book, which is a deep foundation.
The book is titled “Perfect Health Diet”, not “The Perfect Health Diet”. If you think that this is a mistake, consider that the most successful social networking web site of all time started as “The Facebook”, and then changed to simply “Facebook”; which was perceived later as a major improvement.
Moreover, “Perfect Health Diet” makes for a cool and not at all inappropriate acronym – “PHD”.
What people eat has an enormous influence on their lives, and also on the lives of those around them. Nutrition is clearly one of the most important topics in the modern world - it is the source of much happiness and suffering for entire populations. If Albert Einstein and Marie Curie were alive today, they would probably be interested in nutrition, as they were about important topics of their time that were outside their main disciplines and research areas (e.g., the consequences of war, and future war deterrence).
Nutrition attracts the interest of many bright people today. Those who are not professional nutrition researchers often fund their own research, spending hours and hours of their own time studying the literature and even experimenting on themselves. Several of them decide to think deeply and carefully about it. A few, like Paul Jaminet and Shou-Ching Jaminet, decide to write about it, and all of us benefit from their effort.
The Jaminets have PhDs (not copies of their books, degrees). Their main PhD disciplines are somewhat similar to Einstein’s and Curie’s; which is an interesting coincidence. What the Jaminets have written about nutrition is probably analogous, in broad terms, to what Einstein and Curie would have written about nutrition if they were alive today. They would have written about a “unified field theory” of nutrition, informed by chemistry.
To put it simply, the main idea behind this book is to find the “sweet spot” for each major macronutrient (e.g., protein and fat) and micronutrient (e.g., vitamins and minerals) that is important for humans. The sweet spot is the area indicated on the graph below. This is my own simplified interpretation of the authors' more complex graphs on marginal benefits from nutrients.
The book provides detailed information about each of the major nutrients that are important to humans, what their “sweet spot” levels are, and how to obtain them. In this respect the book is very thorough, and also very clear, including plenty of good arguments and empirical research results to back up the recommendations. But this book is much more than that.
Why do I refer to this book as proposing a “unified field theory” of nutrition? The reason is that this book clearly aims at unifying all of the current state of the art knowledge about nutrition, departing from a few fundamental ideas.
One of those fundamental ideas is that a good diet would provide nutrients in the same ratio as those provided by our own tissues when we “cannibalize” them – i.e., when we fast. Another is that human breast milk is a good basis for the estimation of the ratios of macronutrients a human adult would need for optimal health.
And here is where the depth and brilliance with which the authors address these issues can lead to misunderstandings.
For example, when our body “cannibalizes” itself (e.g., at the 16-h mark of a water fast), there is no digestion going on. And, as the authors point out, what you eat, in terms of nutrients, is often not what you get after digestion. It may surprise many to know that a diet rich in vegetables is actually a high fat diet (if you are surprised, you should read the book). One needs to keep these things in mind to understand that not all dietary macronutrient ratios will lead to the same ratios of nutrients after digestion, and that the dietary equivalent of “cannibalizing” oneself is not a beef-only diet.
Another example relates to the issue of human breast milk. Many seem to have misunderstood the authors as implying that the macronutrient ratios in human breast milk are optimal for adult humans. The authors say nothing of the kind. What they do is to use human breast milk as a basis for their estimation of what an adult human should get, based on a few reasonable assumptions. One of the assumptions is that a human adult’s brain consumes proportionally much less sugar than an infant’s.
Yet another example is the idea of “safe starches”, which many seem to have taken as a recommendation that diabetics should eat lots of white rice and potato. The authors have never said such a thing in the book; not even close. "Safe starches", like white rice and sweet potatoes (as well as white potatoes), are presented in the book as good sources of carbohydrates that are also generally free from harmful plant toxins. And they are, if consumed after cooking.
By the way, I have a colleague who has type 2 diabetes and can eat meat with white potatoes without experiencing hyperglycemia, as long as the amount of potato is very small and is eaten after a few bites of meat.
Do I disagree with some of the things that the authors say? Sure I do, but not in a way that would lead to significantly different dietary recommendations. And, who knows, maybe I am wrong.
For example, the authors seem to think that dietary advanced glycation end-products (AGEs) can be a problem for humans, and therefore recommend that you avoid cooking meat at high temperatures (no barbecuing, for example). I have not found any convincing evidence that this is true in healthy people, but following the authors’ advice will not hurt you at all. And if your digestive tract is compromised to the point that undigested food particles are entering your bloodstream, then maybe you should avoid dietary sources of AGEs.
Also, I think that humans tend to adapt to different macronutrient ratios in more fundamental ways than the authors seem to believe they can. These adaptations are long-term ones, and are better understood based on the notion of compensatory adaptation. For instance, a very low carbohydrate diet may bring about some problems in the short term, but long-term adaptations may reverse those problems, without a change in the diet.
The authors should be careful about small errors that may give a bad impression to some experts, and open them up to undue criticism; as experts tend to be very picky and frequently generalize based on small errors. Here is one. The authors seem to imply that eating coconut oil will help feed colon cells, which indeed seem to feed on short-chain fats; not exactly the medium-chain fats abundantly found in coconut oil, but okay. (This may be the main reason why indigestible fiber contributes to colon health, by being converted by bacteria to short-chain fats.) The main problem with the authors' implied claim is that coconut oil, as a fat, will be absorbed in the small intestine, and thus will not reach colon cells in any significant amounts.
Finally, I don’t think that increased animal protein consumption causes decreased longevity; an idea that the authors seem to lean toward. One reason is that seafood consumption is almost universally associated with increased longevity, even when it is heavily consumed, and seafood in general has a very high protein-to-fat ratio (much higher than beef). The connection between high animal protein consumption and decreased longevity suggested by many studies, some of which are cited in the book, is unlikely to be due to the protein itself, in my opinion. That connection is more likely to be due to some patterns that may be associated in certain populations with animal protein consumption (e.g., refined wheat and industrial seed oils consumption).
Thankfully, controversial issues and small errors can be easily addressed online. The authors maintain a popular blog, and they do so in such a way that the blog is truly an extension of the book. This blog is one of my favorites. Perhaps we will see some of the above issues addressed in the blog.
All in all, this seems like a bargain to me. For about 25 bucks (less than that, if you trade in quid; and more, if you do in Yuan), and with some self-determination, you may save thousands of dollars in medical bills. More importantly, you may change your life, and those of the ones around you, for the better.
The book is titled “Perfect Health Diet”, not “The Perfect Health Diet”. If you think that this is a mistake, consider that the most successful social networking web site of all time started as “The Facebook”, and then changed to simply “Facebook”; which was perceived later as a major improvement.
Moreover, “Perfect Health Diet” makes for a cool and not at all inappropriate acronym – “PHD”.
What people eat has an enormous influence on their lives, and also on the lives of those around them. Nutrition is clearly one of the most important topics in the modern world - it is the source of much happiness and suffering for entire populations. If Albert Einstein and Marie Curie were alive today, they would probably be interested in nutrition, as they were about important topics of their time that were outside their main disciplines and research areas (e.g., the consequences of war, and future war deterrence).
Nutrition attracts the interest of many bright people today. Those who are not professional nutrition researchers often fund their own research, spending hours and hours of their own time studying the literature and even experimenting on themselves. Several of them decide to think deeply and carefully about it. A few, like Paul Jaminet and Shou-Ching Jaminet, decide to write about it, and all of us benefit from their effort.
The Jaminets have PhDs (not copies of their books, degrees). Their main PhD disciplines are somewhat similar to Einstein’s and Curie’s; which is an interesting coincidence. What the Jaminets have written about nutrition is probably analogous, in broad terms, to what Einstein and Curie would have written about nutrition if they were alive today. They would have written about a “unified field theory” of nutrition, informed by chemistry.
To put it simply, the main idea behind this book is to find the “sweet spot” for each major macronutrient (e.g., protein and fat) and micronutrient (e.g., vitamins and minerals) that is important for humans. The sweet spot is the area indicated on the graph below. This is my own simplified interpretation of the authors' more complex graphs on marginal benefits from nutrients.
The book provides detailed information about each of the major nutrients that are important to humans, what their “sweet spot” levels are, and how to obtain them. In this respect the book is very thorough, and also very clear, including plenty of good arguments and empirical research results to back up the recommendations. But this book is much more than that.
Why do I refer to this book as proposing a “unified field theory” of nutrition? The reason is that this book clearly aims at unifying all of the current state of the art knowledge about nutrition, departing from a few fundamental ideas.
One of those fundamental ideas is that a good diet would provide nutrients in the same ratio as those provided by our own tissues when we “cannibalize” them – i.e., when we fast. Another is that human breast milk is a good basis for the estimation of the ratios of macronutrients a human adult would need for optimal health.
And here is where the depth and brilliance with which the authors address these issues can lead to misunderstandings.
For example, when our body “cannibalizes” itself (e.g., at the 16-h mark of a water fast), there is no digestion going on. And, as the authors point out, what you eat, in terms of nutrients, is often not what you get after digestion. It may surprise many to know that a diet rich in vegetables is actually a high fat diet (if you are surprised, you should read the book). One needs to keep these things in mind to understand that not all dietary macronutrient ratios will lead to the same ratios of nutrients after digestion, and that the dietary equivalent of “cannibalizing” oneself is not a beef-only diet.
Another example relates to the issue of human breast milk. Many seem to have misunderstood the authors as implying that the macronutrient ratios in human breast milk are optimal for adult humans. The authors say nothing of the kind. What they do is to use human breast milk as a basis for their estimation of what an adult human should get, based on a few reasonable assumptions. One of the assumptions is that a human adult’s brain consumes proportionally much less sugar than an infant’s.
Yet another example is the idea of “safe starches”, which many seem to have taken as a recommendation that diabetics should eat lots of white rice and potato. The authors have never said such a thing in the book; not even close. "Safe starches", like white rice and sweet potatoes (as well as white potatoes), are presented in the book as good sources of carbohydrates that are also generally free from harmful plant toxins. And they are, if consumed after cooking.
By the way, I have a colleague who has type 2 diabetes and can eat meat with white potatoes without experiencing hyperglycemia, as long as the amount of potato is very small and is eaten after a few bites of meat.
Do I disagree with some of the things that the authors say? Sure I do, but not in a way that would lead to significantly different dietary recommendations. And, who knows, maybe I am wrong.
For example, the authors seem to think that dietary advanced glycation end-products (AGEs) can be a problem for humans, and therefore recommend that you avoid cooking meat at high temperatures (no barbecuing, for example). I have not found any convincing evidence that this is true in healthy people, but following the authors’ advice will not hurt you at all. And if your digestive tract is compromised to the point that undigested food particles are entering your bloodstream, then maybe you should avoid dietary sources of AGEs.
Also, I think that humans tend to adapt to different macronutrient ratios in more fundamental ways than the authors seem to believe they can. These adaptations are long-term ones, and are better understood based on the notion of compensatory adaptation. For instance, a very low carbohydrate diet may bring about some problems in the short term, but long-term adaptations may reverse those problems, without a change in the diet.
The authors should be careful about small errors that may give a bad impression to some experts, and open them up to undue criticism; as experts tend to be very picky and frequently generalize based on small errors. Here is one. The authors seem to imply that eating coconut oil will help feed colon cells, which indeed seem to feed on short-chain fats; not exactly the medium-chain fats abundantly found in coconut oil, but okay. (This may be the main reason why indigestible fiber contributes to colon health, by being converted by bacteria to short-chain fats.) The main problem with the authors' implied claim is that coconut oil, as a fat, will be absorbed in the small intestine, and thus will not reach colon cells in any significant amounts.
Finally, I don’t think that increased animal protein consumption causes decreased longevity; an idea that the authors seem to lean toward. One reason is that seafood consumption is almost universally associated with increased longevity, even when it is heavily consumed, and seafood in general has a very high protein-to-fat ratio (much higher than beef). The connection between high animal protein consumption and decreased longevity suggested by many studies, some of which are cited in the book, is unlikely to be due to the protein itself, in my opinion. That connection is more likely to be due to some patterns that may be associated in certain populations with animal protein consumption (e.g., refined wheat and industrial seed oils consumption).
Thankfully, controversial issues and small errors can be easily addressed online. The authors maintain a popular blog, and they do so in such a way that the blog is truly an extension of the book. This blog is one of my favorites. Perhaps we will see some of the above issues addressed in the blog.
All in all, this seems like a bargain to me. For about 25 bucks (less than that, if you trade in quid; and more, if you do in Yuan), and with some self-determination, you may save thousands of dollars in medical bills. More importantly, you may change your life, and those of the ones around you, for the better.
Monday, August 15, 2011
Book review: Sugar Nation
Jeff O’Connell is the Editor-in-Chief for Bodybuilding.com, a former executive writer for Men’s Health, and former Editor-in-Chief of Muscle & Fitness. He is also the author of a few bestselling books on fitness.
It is obvious that Jeff is someone who can write, and this comes across very clearly in his new book, Sugar Nation.
Now, with a title like this, Sugar Nation, I was expecting a book discussing trends of sugar consumption in the USA, and the related trends in various degenerative diseases. So when I started reading the book I was slightly put off by what seemed to be a book about a very personal journey, written in the first person by the author.
Yet, after reading it for a while I was hooked, and literally could not put the book down. Jeff has managed to write something of a page-turner, combining a harrowing personal account with carefully researched scientific information, about a relatively rare form of type 2 diabetes.
Jeff has a genetic propensity to insulin resistance, just like his father did. What makes Jeff’s case a little unusual is that Jeff is thin, and apparently has difficulty gaining weight. The most common type of diabetes is type 2, and most of those who develop type 2 diabetes do so via the metabolic syndrome. Typically this involves becoming obese or overweight before getting diagnosed as a diabetic.
In fact, in a thin person who is insulin resistant it seems that body fat cells become resistant to the normal actions of insulin much sooner than in the obese. This essentially means that they start rejecting fat. This is a problem, because fat should either be stored in fat cells (adipocytes) or used for energy; as opposed to being deposited in other tissues or remaining in circulation. Apparently this makes it even more difficult for them to control glucose levels once insulin resistance sets in; there is no “cushion”, so to speak.
Still, Jeff appears to believe that his case was that of a skinny-fat person, where body fat percentage is a lot higher than expected based on a low body mass index, and where excess visceral fat is a main culprit. In fact, Jeff seems to think that most cases of thin folks who developed type 2 diabetes are like this, as they follow the metabolic syndrome progression pattern. Fasting triglycerides go up and HDL cholesterol goes down, among other things, but in a skinny-fat body.
Somewhat predictably, what Jeff found out is that, in his case, adopting a low carbohydrate diet made an enormous difference. In fact, it made the difference between having a fairly normal life versus constantly suffering through hypoglycemic episodes. And, at the stage in which Jeff caught the problem, he did not have to avoid all natural carbohydrate-rich foods, not even things like apples. (He had to control portions though.) It is the refined carbohydrate-rich foods that were the problem for him.
I must say that I disagree with a few of the statements in the book. For example, the author seems to believe that excess saturated fat and salt may be quite unhealthy. I think that foods rich in refined carbohydrates and sugars are much more of a problem; cut them out and often excess saturated fat and salt either cease to be a problem, or become healthy. Jeff doesn’t seem to think that excess omega-6 fats can also cause diabetes; I believe the opposite to be true, via a pro-inflammatory path.
Still, this is a great book on so many levels. Jeff meticulously records his experience dealing with doctors, most of whom seem to be clueless as to what to do to prevent the damage that is caused by abnormally high glucose levels. This happens even though diabetes is those doctors’ main area of expertise. He talks about himself with complete abandon, and manages to mix that up with quite a lot of relevant research on diabetes. He gives us an insider’s view of the professional bodybuilding culture, including its use of insulin injections. His description of the Amish is very interesting and somewhat surprising.
For these reasons and a few others, I think this is a great book, and highly recommend it!
(Source: Bodybuilding.com)
It is obvious that Jeff is someone who can write, and this comes across very clearly in his new book, Sugar Nation.
Now, with a title like this, Sugar Nation, I was expecting a book discussing trends of sugar consumption in the USA, and the related trends in various degenerative diseases. So when I started reading the book I was slightly put off by what seemed to be a book about a very personal journey, written in the first person by the author.
Yet, after reading it for a while I was hooked, and literally could not put the book down. Jeff has managed to write something of a page-turner, combining a harrowing personal account with carefully researched scientific information, about a relatively rare form of type 2 diabetes.
Jeff has a genetic propensity to insulin resistance, just like his father did. What makes Jeff’s case a little unusual is that Jeff is thin, and apparently has difficulty gaining weight. The most common type of diabetes is type 2, and most of those who develop type 2 diabetes do so via the metabolic syndrome. Typically this involves becoming obese or overweight before getting diagnosed as a diabetic.
In fact, in a thin person who is insulin resistant it seems that body fat cells become resistant to the normal actions of insulin much sooner than in the obese. This essentially means that they start rejecting fat. This is a problem, because fat should either be stored in fat cells (adipocytes) or used for energy; as opposed to being deposited in other tissues or remaining in circulation. Apparently this makes it even more difficult for them to control glucose levels once insulin resistance sets in; there is no “cushion”, so to speak.
Still, Jeff appears to believe that his case was that of a skinny-fat person, where body fat percentage is a lot higher than expected based on a low body mass index, and where excess visceral fat is a main culprit. In fact, Jeff seems to think that most cases of thin folks who developed type 2 diabetes are like this, as they follow the metabolic syndrome progression pattern. Fasting triglycerides go up and HDL cholesterol goes down, among other things, but in a skinny-fat body.
Somewhat predictably, what Jeff found out is that, in his case, adopting a low carbohydrate diet made an enormous difference. In fact, it made the difference between having a fairly normal life versus constantly suffering through hypoglycemic episodes. And, at the stage in which Jeff caught the problem, he did not have to avoid all natural carbohydrate-rich foods, not even things like apples. (He had to control portions though.) It is the refined carbohydrate-rich foods that were the problem for him.
I must say that I disagree with a few of the statements in the book. For example, the author seems to believe that excess saturated fat and salt may be quite unhealthy. I think that foods rich in refined carbohydrates and sugars are much more of a problem; cut them out and often excess saturated fat and salt either cease to be a problem, or become healthy. Jeff doesn’t seem to think that excess omega-6 fats can also cause diabetes; I believe the opposite to be true, via a pro-inflammatory path.
Still, this is a great book on so many levels. Jeff meticulously records his experience dealing with doctors, most of whom seem to be clueless as to what to do to prevent the damage that is caused by abnormally high glucose levels. This happens even though diabetes is those doctors’ main area of expertise. He talks about himself with complete abandon, and manages to mix that up with quite a lot of relevant research on diabetes. He gives us an insider’s view of the professional bodybuilding culture, including its use of insulin injections. His description of the Amish is very interesting and somewhat surprising.
For these reasons and a few others, I think this is a great book, and highly recommend it!
Monday, May 2, 2011
Strength training plus fasting regularly, and becoming diabetic!? No, it is just compensatory adaptation at work
One common outcome of doing glycogen-depleting exercise (e.g., strength training, sprinting) in combination with intermittent fasting is an increase in growth hormone (GH) levels. See this post for a graph showing the acute effect on GH levels of glycogen-depleting exercise. This effect applies to both men and women, and is generally healthy, leading to improvements in mood and many health markers.
It is a bit like GH therapy, with GH being “administered” to you by your own body. Both glycogen-depleting exercise and intermittent fasting increase GH levels; apparently they have an additive effect when done together.
Still, a complaint that one sees a lot from people who have been doing glycogen-depleting exercise and intermittent fasting for a while is that their fasting blood glucose levels go up. This is particularly true for obese folks (after they lose body fat), as obesity tends to be associated with low GH levels, although it is not restricted to the obese. In fact, many people decide to stop what they were doing because they think that they are becoming insulin resistant and on their way to developing type 2 diabetes. And, surely enough, when they stop, their blood glucose levels go down.
Guess what? If your blood glucose levels are going up quite a bit in response to glycogen-depleting exercise and intermittent fasting, maybe you are one of the lucky folks who are very effective at increasing their GH levels. The blood glucose increase effect is temporary, although it can last months, and is indeed caused by insulin resistance. An HbA1c test should also show an increase in hemoglobin glycation.
Over time, however, you will very likely become more insulin sensitive. What is happening is compensatory adaptation, with different short-term and long-term responses. In the short term, your body is trying to become a more efficient fat-burning machine, and GH is involved in this adaptation. But in the short term, GH leads to insulin resistance, probably via actions on muscle and fat cells. This gradually improves in the long term, possibly through a concomitant increase in liver insulin sensitivity and glycogen storage capacity.
This is somewhat similar to the response to GH therapy.
The figure below is from Johannsson et al. (1997). It shows what happened in terms of glucose metabolism when a group of obese men were administered recombinant GH for 9 months. The participants were aged 48–66, and were given in daily doses the equivalent to what would be needed to bring their GH levels to approximately what they were at age 20. For glucose, 5 mmol is about 90 mg, 5.5 is about 99, and 6 is about 108. GDR is glucose disposal rate; a measure of how quickly glucose is cleared from the blood.
As you can see, insulin sensitivity initially goes down for the GH group, and fasting blood glucose goes up quite a lot. But after 9 months the GH group has better insulin sensitivity. Their GDR is the same as in the placebo group, but with lower circulating insulin. The folks in the GH group also have significantly less body fat, and have better health markers, than those who took the placebo.
There is such a thing as sudden-onset type 2-like diabetes, but it is very rare (see Michael’s blog). Usually type 2 diabetes “telegraphs” its arrival through gradually increasing fasting blood glucose and HbA1c. However, those normally come together with other things, notably a decrease in HDL cholesterol and an increase in fasting triglycerides. Folks who do glycogen-depleting exercise and intermittent fasting tend to see the opposite – an increase in HDL cholesterol and a decrease in triglycerides.
So, if you are doing things that have the potential to increase your GH levels, a standard lipid panel can help you try to figure out whether insulin resistance is benign or not, if it happens.
By the way, GH and cortisol levels are correlated, which is often why some associate responses to glycogen-depleting exercise and intermittent fasting with esoteric nonsense that has no basis in scientific research like “adrenal fatigue”. Cortisol levels are meant to go up and down, but they should not go up and stay up while you are sitting down.
Avoid chronic stress, and keep on doing glycogen-depleting exercise and intermittent fasting; there is overwhelming scientific evidence that these things are good for you.
It is a bit like GH therapy, with GH being “administered” to you by your own body. Both glycogen-depleting exercise and intermittent fasting increase GH levels; apparently they have an additive effect when done together.
Still, a complaint that one sees a lot from people who have been doing glycogen-depleting exercise and intermittent fasting for a while is that their fasting blood glucose levels go up. This is particularly true for obese folks (after they lose body fat), as obesity tends to be associated with low GH levels, although it is not restricted to the obese. In fact, many people decide to stop what they were doing because they think that they are becoming insulin resistant and on their way to developing type 2 diabetes. And, surely enough, when they stop, their blood glucose levels go down.
Guess what? If your blood glucose levels are going up quite a bit in response to glycogen-depleting exercise and intermittent fasting, maybe you are one of the lucky folks who are very effective at increasing their GH levels. The blood glucose increase effect is temporary, although it can last months, and is indeed caused by insulin resistance. An HbA1c test should also show an increase in hemoglobin glycation.
Over time, however, you will very likely become more insulin sensitive. What is happening is compensatory adaptation, with different short-term and long-term responses. In the short term, your body is trying to become a more efficient fat-burning machine, and GH is involved in this adaptation. But in the short term, GH leads to insulin resistance, probably via actions on muscle and fat cells. This gradually improves in the long term, possibly through a concomitant increase in liver insulin sensitivity and glycogen storage capacity.
This is somewhat similar to the response to GH therapy.
The figure below is from Johannsson et al. (1997). It shows what happened in terms of glucose metabolism when a group of obese men were administered recombinant GH for 9 months. The participants were aged 48–66, and were given in daily doses the equivalent to what would be needed to bring their GH levels to approximately what they were at age 20. For glucose, 5 mmol is about 90 mg, 5.5 is about 99, and 6 is about 108. GDR is glucose disposal rate; a measure of how quickly glucose is cleared from the blood.
As you can see, insulin sensitivity initially goes down for the GH group, and fasting blood glucose goes up quite a lot. But after 9 months the GH group has better insulin sensitivity. Their GDR is the same as in the placebo group, but with lower circulating insulin. The folks in the GH group also have significantly less body fat, and have better health markers, than those who took the placebo.
There is such a thing as sudden-onset type 2-like diabetes, but it is very rare (see Michael’s blog). Usually type 2 diabetes “telegraphs” its arrival through gradually increasing fasting blood glucose and HbA1c. However, those normally come together with other things, notably a decrease in HDL cholesterol and an increase in fasting triglycerides. Folks who do glycogen-depleting exercise and intermittent fasting tend to see the opposite – an increase in HDL cholesterol and a decrease in triglycerides.
So, if you are doing things that have the potential to increase your GH levels, a standard lipid panel can help you try to figure out whether insulin resistance is benign or not, if it happens.
By the way, GH and cortisol levels are correlated, which is often why some associate responses to glycogen-depleting exercise and intermittent fasting with esoteric nonsense that has no basis in scientific research like “adrenal fatigue”. Cortisol levels are meant to go up and down, but they should not go up and stay up while you are sitting down.
Avoid chronic stress, and keep on doing glycogen-depleting exercise and intermittent fasting; there is overwhelming scientific evidence that these things are good for you.
Friday, April 9, 2010
The huge gap between glycemic loads of refined and unrefined carbohydrate-rich foods
I often refer to foods rich in refined carbohydrates in this blog as among the most disease-promoting agents of modern diets. Yet, when one looks at the glycemic indices of foods rich in refined and unrefined carbohydrates, they are not all that different.
The glycemic index of a carbohydrate-rich food reflects how quickly the food is digested and generate a blood glucose response. Technically, it is measured as the area under a two-hour blood glucose response curve following the consumption of a portion of the food with a fixed amount of carbohydrates.
A measure that reflects much better the underlying difference between foods rich in refined and unrefined carbohydrates is the glycemic load, which is the product of the glycemic index of a food by the carbohydrate content in a 100 g portion of the food.
The glycemic load is also the reason for one known fact among diabetics. If a diabetic person eats a very small amount of a high glycemic index food, he or she will have a relatively small increase in blood sugar. If that person consumes a large amount of the same food, the increase in blood sugar will be dramatic.
The table below (click on it to enlarge) shows the remarkable differences between the glycemic loads of foods rich in refined and unrefined carbohydrates. It was taken from an article co-authored by Loren Cordain, Michael R. Eades, and Mary D. Eades (full reference at the end of this post).
At the time of this post’s writing, the article from which the table above was taken had a solid number of citations to it; a total of 74 citations on Google Scholar’s database. It is an excellent article, which I highly recommend reading in full (the link to the online full text is at the end of this post).
What is the reason for the differences in glycemic loads?
The answer is that foods rich in unrefined carbohydrates, even those with a high glycemic index (such as potatoes), are also packed with a number of other things – e.g., micronutrients, fiber, water, and even some protein. An Irish (white) potato is 75 percent water. By comparison, cereal, without milk added, is about 1 percent water. You have to add a lot of whole milk to it to make it a bit healthier. And even unsweetened whole milk is about 5 percent sugar.
There was nothing even remotely similar to modern foods rich in refined carbohydrates in the diet of our Paleolithic ancestors. In fact, the types of food rich in refined carbohydrates shown on the table above are very recent, typically dating back to less than a hundred years ago. That is, they are so recent that it is unlikely that any of us have genetic adaptations to those types of food.
Once one’s glucose metabolism is seriously impaired, which seems to be associated with consumption over many years of refined carbohydrates and sugars (as well as some genetic predisposition, which may have evolved among some of our ancestors), then even the foods with high glycemic index and low glycemic load (e.g., potato) will lead to highly elevated glucose levels if eaten in more than very small amounts.
Insulin resistant individuals should avoid even foods with high glycemic index and low glycemic load, as well as any food that significantly increases their blood glucose levels after a meal, because highly elevated glucose levels are toxic to various tissues in the body. The longer those highly elevated serum glucose levels are maintained, the more damage is done; e.g., 2 hours as opposed to 30 minutes at 180 mg/dl. One reason why they are toxic is because they lead to high levels of protein glycation; this is a process whereby sugar binds to protein and “warps” it, impairing its functions.
Generally speaking, the more glycation is going on in our body, the more accelerated is the aging process.
Reference:
Loren Cordain, Michael R. Eades, Mary D. Eades (2003). Hyperinsulinemic diseases of civilization: More than just Syndrome X. Comparative Biochemistry and Physiology: Part A, 136, 95–112.
The glycemic index of a carbohydrate-rich food reflects how quickly the food is digested and generate a blood glucose response. Technically, it is measured as the area under a two-hour blood glucose response curve following the consumption of a portion of the food with a fixed amount of carbohydrates.
A measure that reflects much better the underlying difference between foods rich in refined and unrefined carbohydrates is the glycemic load, which is the product of the glycemic index of a food by the carbohydrate content in a 100 g portion of the food.
The glycemic load is also the reason for one known fact among diabetics. If a diabetic person eats a very small amount of a high glycemic index food, he or she will have a relatively small increase in blood sugar. If that person consumes a large amount of the same food, the increase in blood sugar will be dramatic.
The table below (click on it to enlarge) shows the remarkable differences between the glycemic loads of foods rich in refined and unrefined carbohydrates. It was taken from an article co-authored by Loren Cordain, Michael R. Eades, and Mary D. Eades (full reference at the end of this post).
At the time of this post’s writing, the article from which the table above was taken had a solid number of citations to it; a total of 74 citations on Google Scholar’s database. It is an excellent article, which I highly recommend reading in full (the link to the online full text is at the end of this post).
What is the reason for the differences in glycemic loads?
The answer is that foods rich in unrefined carbohydrates, even those with a high glycemic index (such as potatoes), are also packed with a number of other things – e.g., micronutrients, fiber, water, and even some protein. An Irish (white) potato is 75 percent water. By comparison, cereal, without milk added, is about 1 percent water. You have to add a lot of whole milk to it to make it a bit healthier. And even unsweetened whole milk is about 5 percent sugar.
There was nothing even remotely similar to modern foods rich in refined carbohydrates in the diet of our Paleolithic ancestors. In fact, the types of food rich in refined carbohydrates shown on the table above are very recent, typically dating back to less than a hundred years ago. That is, they are so recent that it is unlikely that any of us have genetic adaptations to those types of food.
Once one’s glucose metabolism is seriously impaired, which seems to be associated with consumption over many years of refined carbohydrates and sugars (as well as some genetic predisposition, which may have evolved among some of our ancestors), then even the foods with high glycemic index and low glycemic load (e.g., potato) will lead to highly elevated glucose levels if eaten in more than very small amounts.
Insulin resistant individuals should avoid even foods with high glycemic index and low glycemic load, as well as any food that significantly increases their blood glucose levels after a meal, because highly elevated glucose levels are toxic to various tissues in the body. The longer those highly elevated serum glucose levels are maintained, the more damage is done; e.g., 2 hours as opposed to 30 minutes at 180 mg/dl. One reason why they are toxic is because they lead to high levels of protein glycation; this is a process whereby sugar binds to protein and “warps” it, impairing its functions.
Generally speaking, the more glycation is going on in our body, the more accelerated is the aging process.
Reference:
Loren Cordain, Michael R. Eades, Mary D. Eades (2003). Hyperinsulinemic diseases of civilization: More than just Syndrome X. Comparative Biochemistry and Physiology: Part A, 136, 95–112.
Labels:
diabetes,
glycation,
glycemic index,
glycemic load,
refined carbs,
research
Subscribe to:
Posts (Atom)


